Kaguya Terrain Camera USGS Generated Digital Terrain Models
These data can be accessed in three ways:
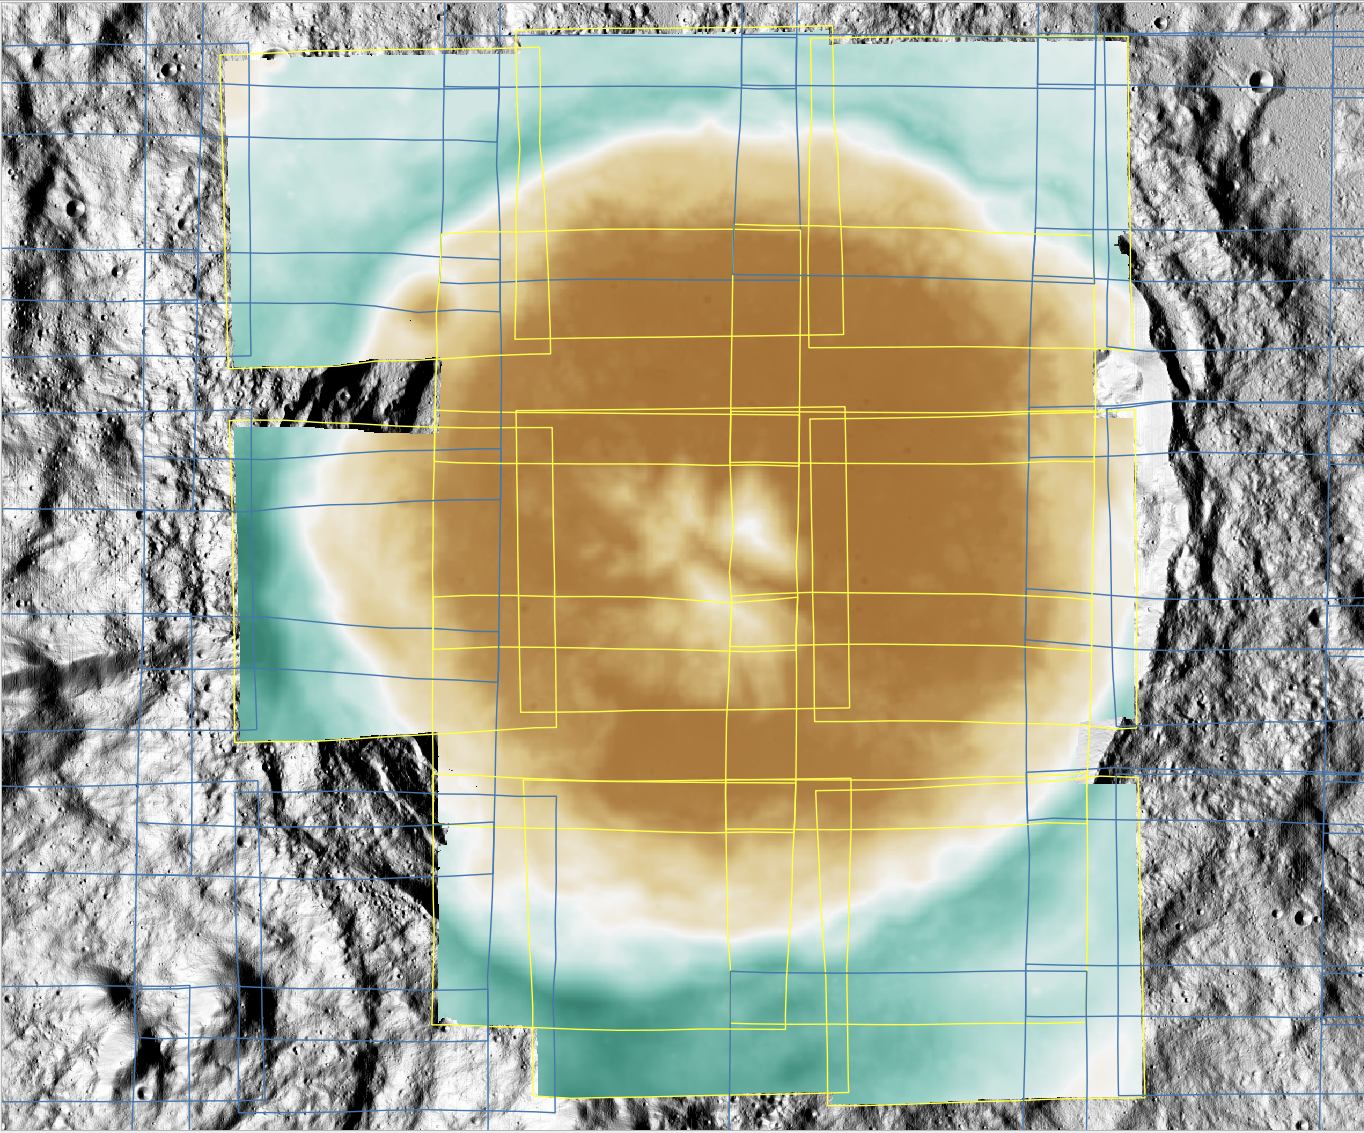
A Kaguya TC DTM observation mosaic with all DTMs using the same color ramp. Overlaying the DTMs are footprints showing the expected extent of each DTM in the dataset. Yellow footprints indicate that the DTM is included in the mosaic and blue footprints indicate that the DTM is omitted.
The Kaguya Terrain Camera analysis-ready data documentation provides an overview of the mission and sensors that were used as inputs to derive these data. Readers are advised to read the overview section of that documentation that describes the mission orbits, data resolutions, and physical sensors. The Kaguya spacecraft captured over 220,000 Terrain Camera (TC) observations in stereoscopic viewing mode, resulting in overlapping, fore and aft pointing data collection. In sum, we estimate that at least 361,000 candidate stereopairs exist with resolutions, orbits, and view geometries suitable for stereophotogrammetric DTM generation. The Kaguya TC USGS Generated DTM data set includes over 127,000 DTMs that wrap the Moon globally from 70˚ north latitude to 70˚ south latitude. The process used to select stereopairs for processing is described in detail below. The DTMs in this data set seek to fulfill the following goals:
- Exhibit improved Minimum Reliably Resolvable Feature (MRRF) better than the SLDEM2015 product. This improvement is a function of input data resolution and stereopair view geometry.
- Achieve near-global coverage while biasing towards the extended mission phase when the spacecraft orbit was lower and data resolution generally was improved.
- Create DTMs at least 0.5˚ latitude in total along-track size.
- Produce overlapping DTM coverage to support accuracy and precision analysis of the results.
The DTMs in this data set are released using the standard three-times input image resolution rule of thumb ( Citation: Kirk, Howington-Kraus & al., 2008 Kirk, R., Howington-Kraus, E., Rosiek, M., Anderson, J., Archinal, B., Becker, K., Cook, D., Galuszka, D., Geissler, P., Hare, T., Holmberg, I., Keszthelyi, L., Redding, B., Delamere, W., Gallagher, D., Chapel, J., Eliason, E., King, R. & McEwen, A. (2008). Ultrahigh resolution topographic mapping of Mars with MRO HiRISE stereo images: Meter-scale slopes of candidate Phoenix landing sites. Journal of Geophysical Research: Planets, 113(E3). https://doi.org/https://doi.org/10.1029/2007JE003000 ; Citation: Kirk, Fergason & al., 2020 Kirk, R., Fergason, R., Redding, B., Galuszka, D., Smith, E., Mayer, D., Hare, T. & Gwinner, K. (2020). Evaluating Stereo DTM Quality at Jezero Crater, Mars With HRSC, CTX, and HiRISE Images. The International Archives of the Photogrammetry, Remote Sensing and Spatial Information Sciences, XLIII-B3-2020. 1129–1136. https://doi.org/10.5194/isprs-archives-XLIII-B3-2020-1129-2020 ) , resulting in DTM resolutions between 7 and 37 meters per pixel.
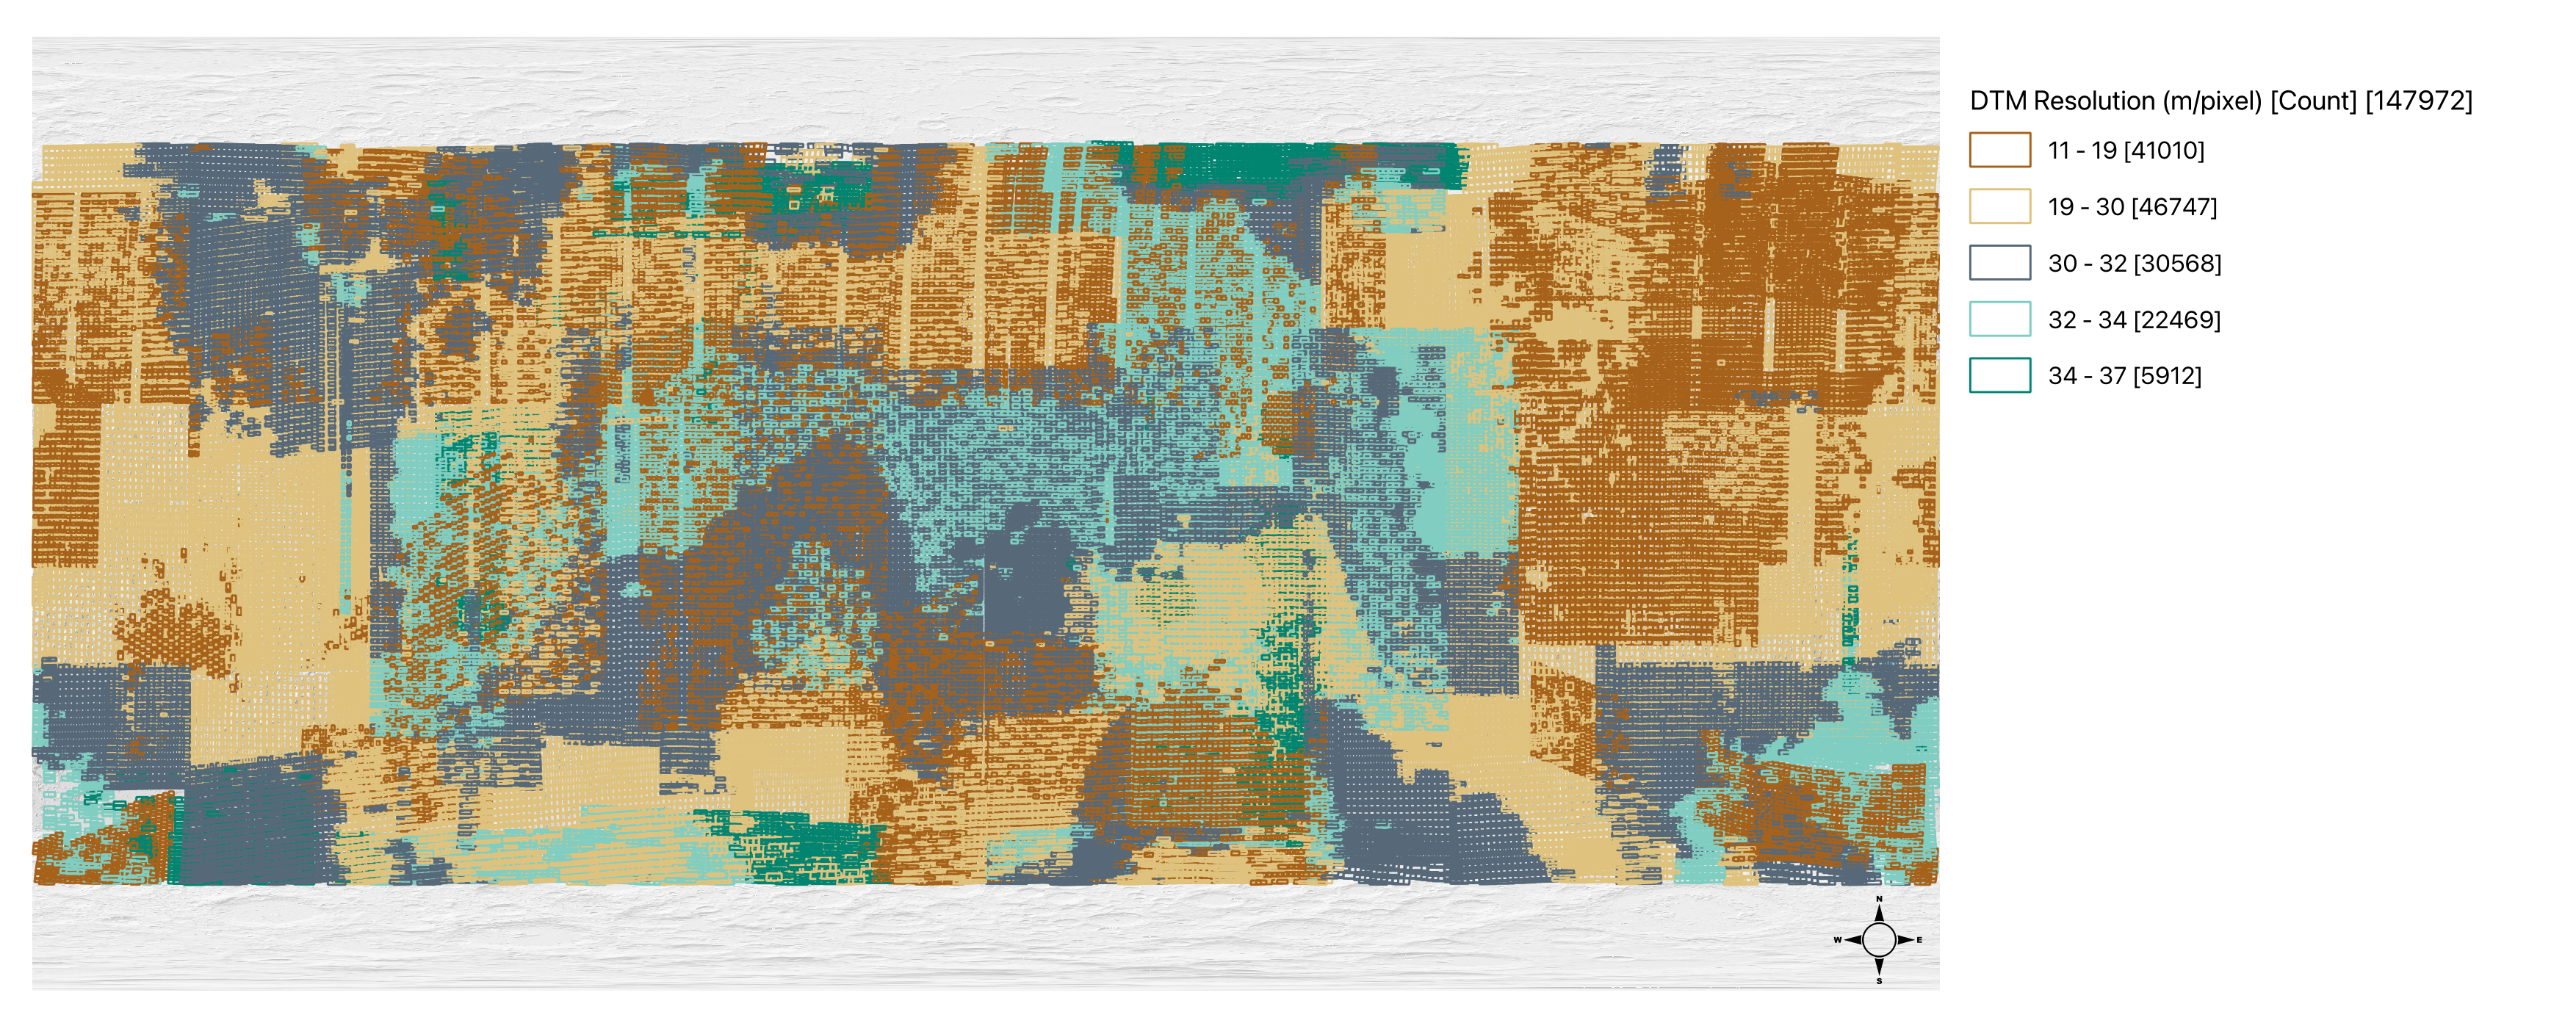
Kaguya TC DTMs over a LOLA hillshade showing the distribution of DTMs, colored by image resolution. The longitude domain is -180 to 180 with a center longitude of 0˚
The sensor model intrinsics (distortion model and focal length) have been reestimated as a part of this work. The sensor model intrinsics used to create these DTMs differ from the JAXA-published sensor model (in the SPICE IK kernel) as of May 2024. We describe the process used to model the sensor model intrinsics below. In short, the improved intrinsics have improved the vertical and horizontal co-registration of the DTMs.
The input stereopairs were pre-processed using the same methodology as used in the
Kaguya TC ARD release
. In addition, the ISIS caminfo and footprintinit tools were run to provide the geometry and footprints, respectively, needed to identify stereopairs.
Candidate stereopairs were selected to meet the goals enumerated above. We selected observations with: (1) intersecting geometries, (2) from the same orbit, (3) and strip, (4) in the 70N - 70S processing region, (5) and where the incidence angle of the first observation was less than the incidence angle of the second observation. This subset yielded 361100 candidate DTMs across all mission phases. Next, we classified the likelihood of generating a high-quality DTM based on incidence angle with classes as follows: This analysis yields six DTMs classes based upon mission phase (n=2) and potential quality (n=3).
When generating DTMs a systematic bowing in the derived point clouds was identified. This bowing is illustrated in the figure below and manifested as a -20 meter offset at each DTM center and a +20 meter offset at both DTM, along-track edges (E/W). These offsets were systematic and larger than expected given the input data resolution.
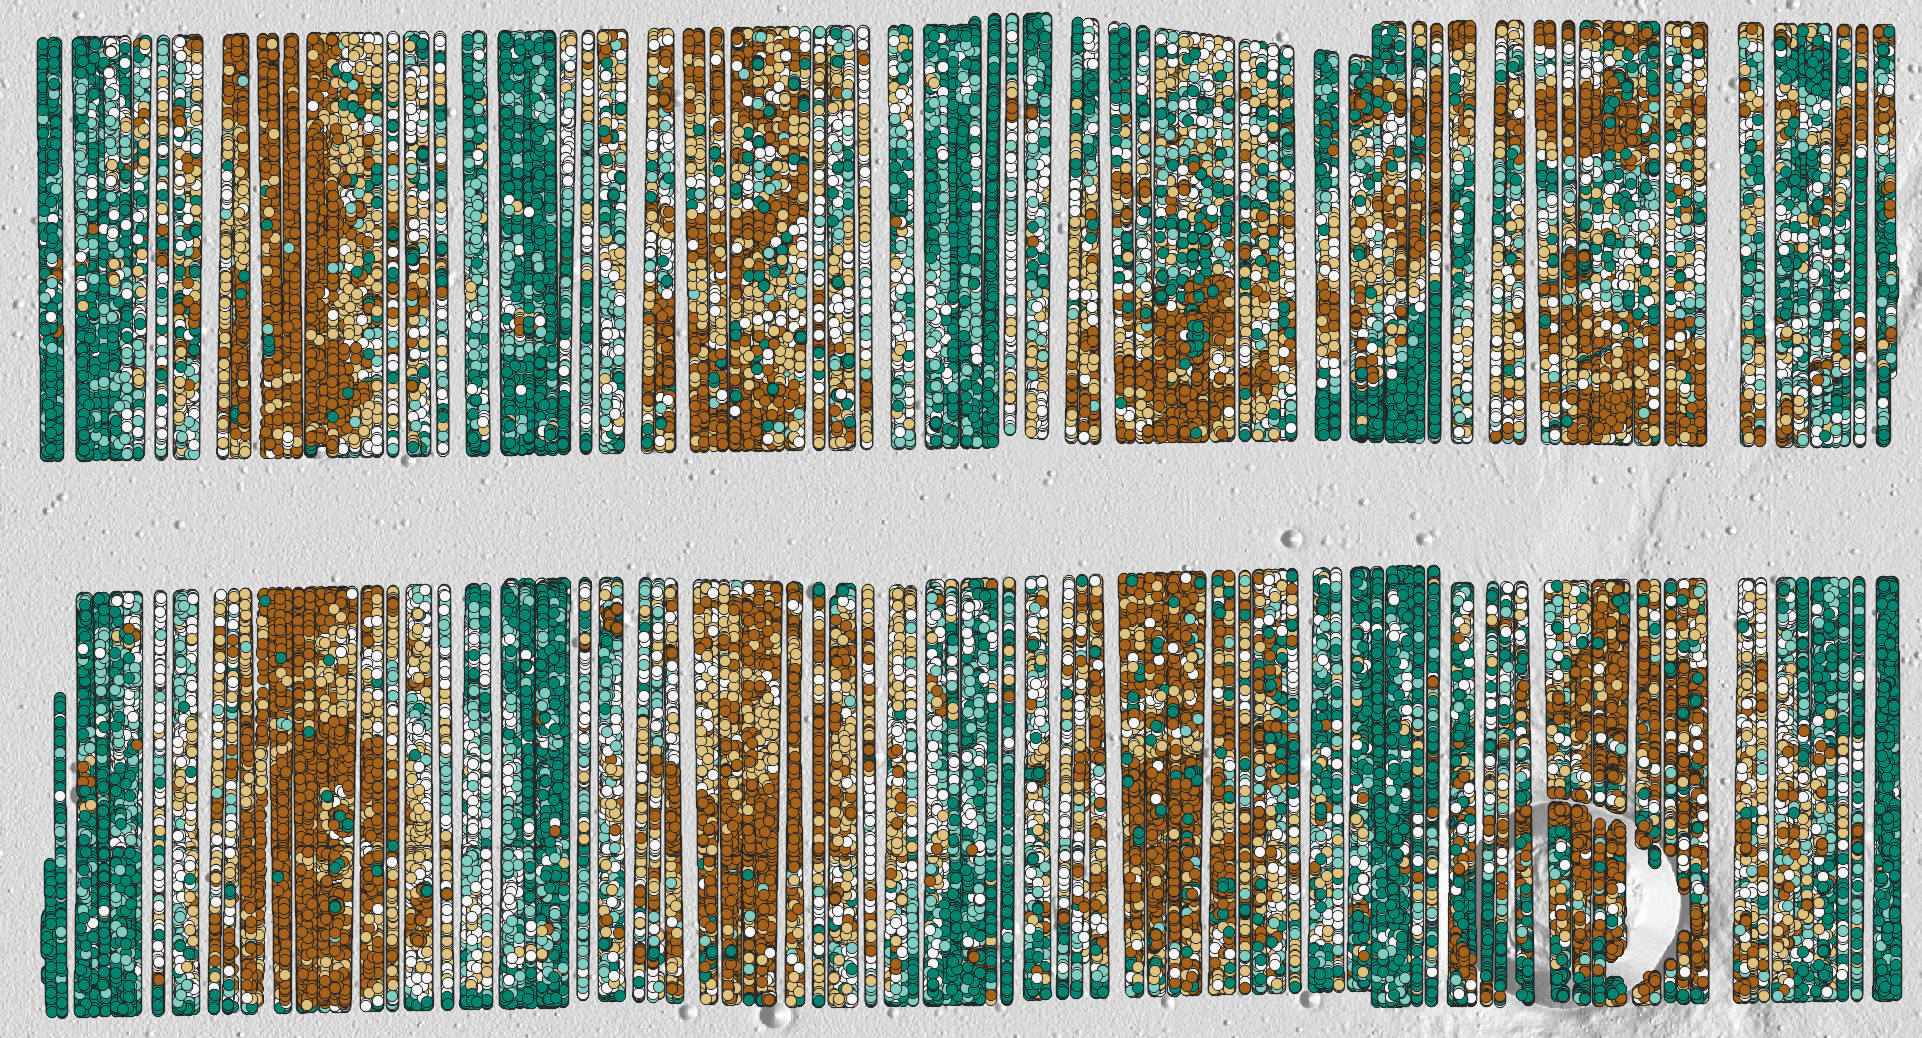
Alignment metrics between LOLA spot observations and eight Kaguya TC, ASP derived point clouds. The dark brown points are systematically 20 meters below LOLA, at the data center, along-track and the dark green points are systematically 20 meters above LOLA, at the data edges, along-track.
DTM mosaics were generated and the sensor model intrinsics: boresight, focal length, and distortion coefficients were estimated. These are believed to be improved sensor model intrinsics. As described below, they reduced the vertical offsets to within the estimated error budget and improved horizontal ro-registration (removing parallax-induced distortions). The figure below shows an eleven-DTM mosaic with an across-track transect drawn. No significant offsets are visible in either the overlapping DTMs or the transect. This is one indication (others include the improved horizontal alignment and the removal of systematic ellipse-shaped errors in the intersection error rasters) that the intrinsics better model the actual sensor model.
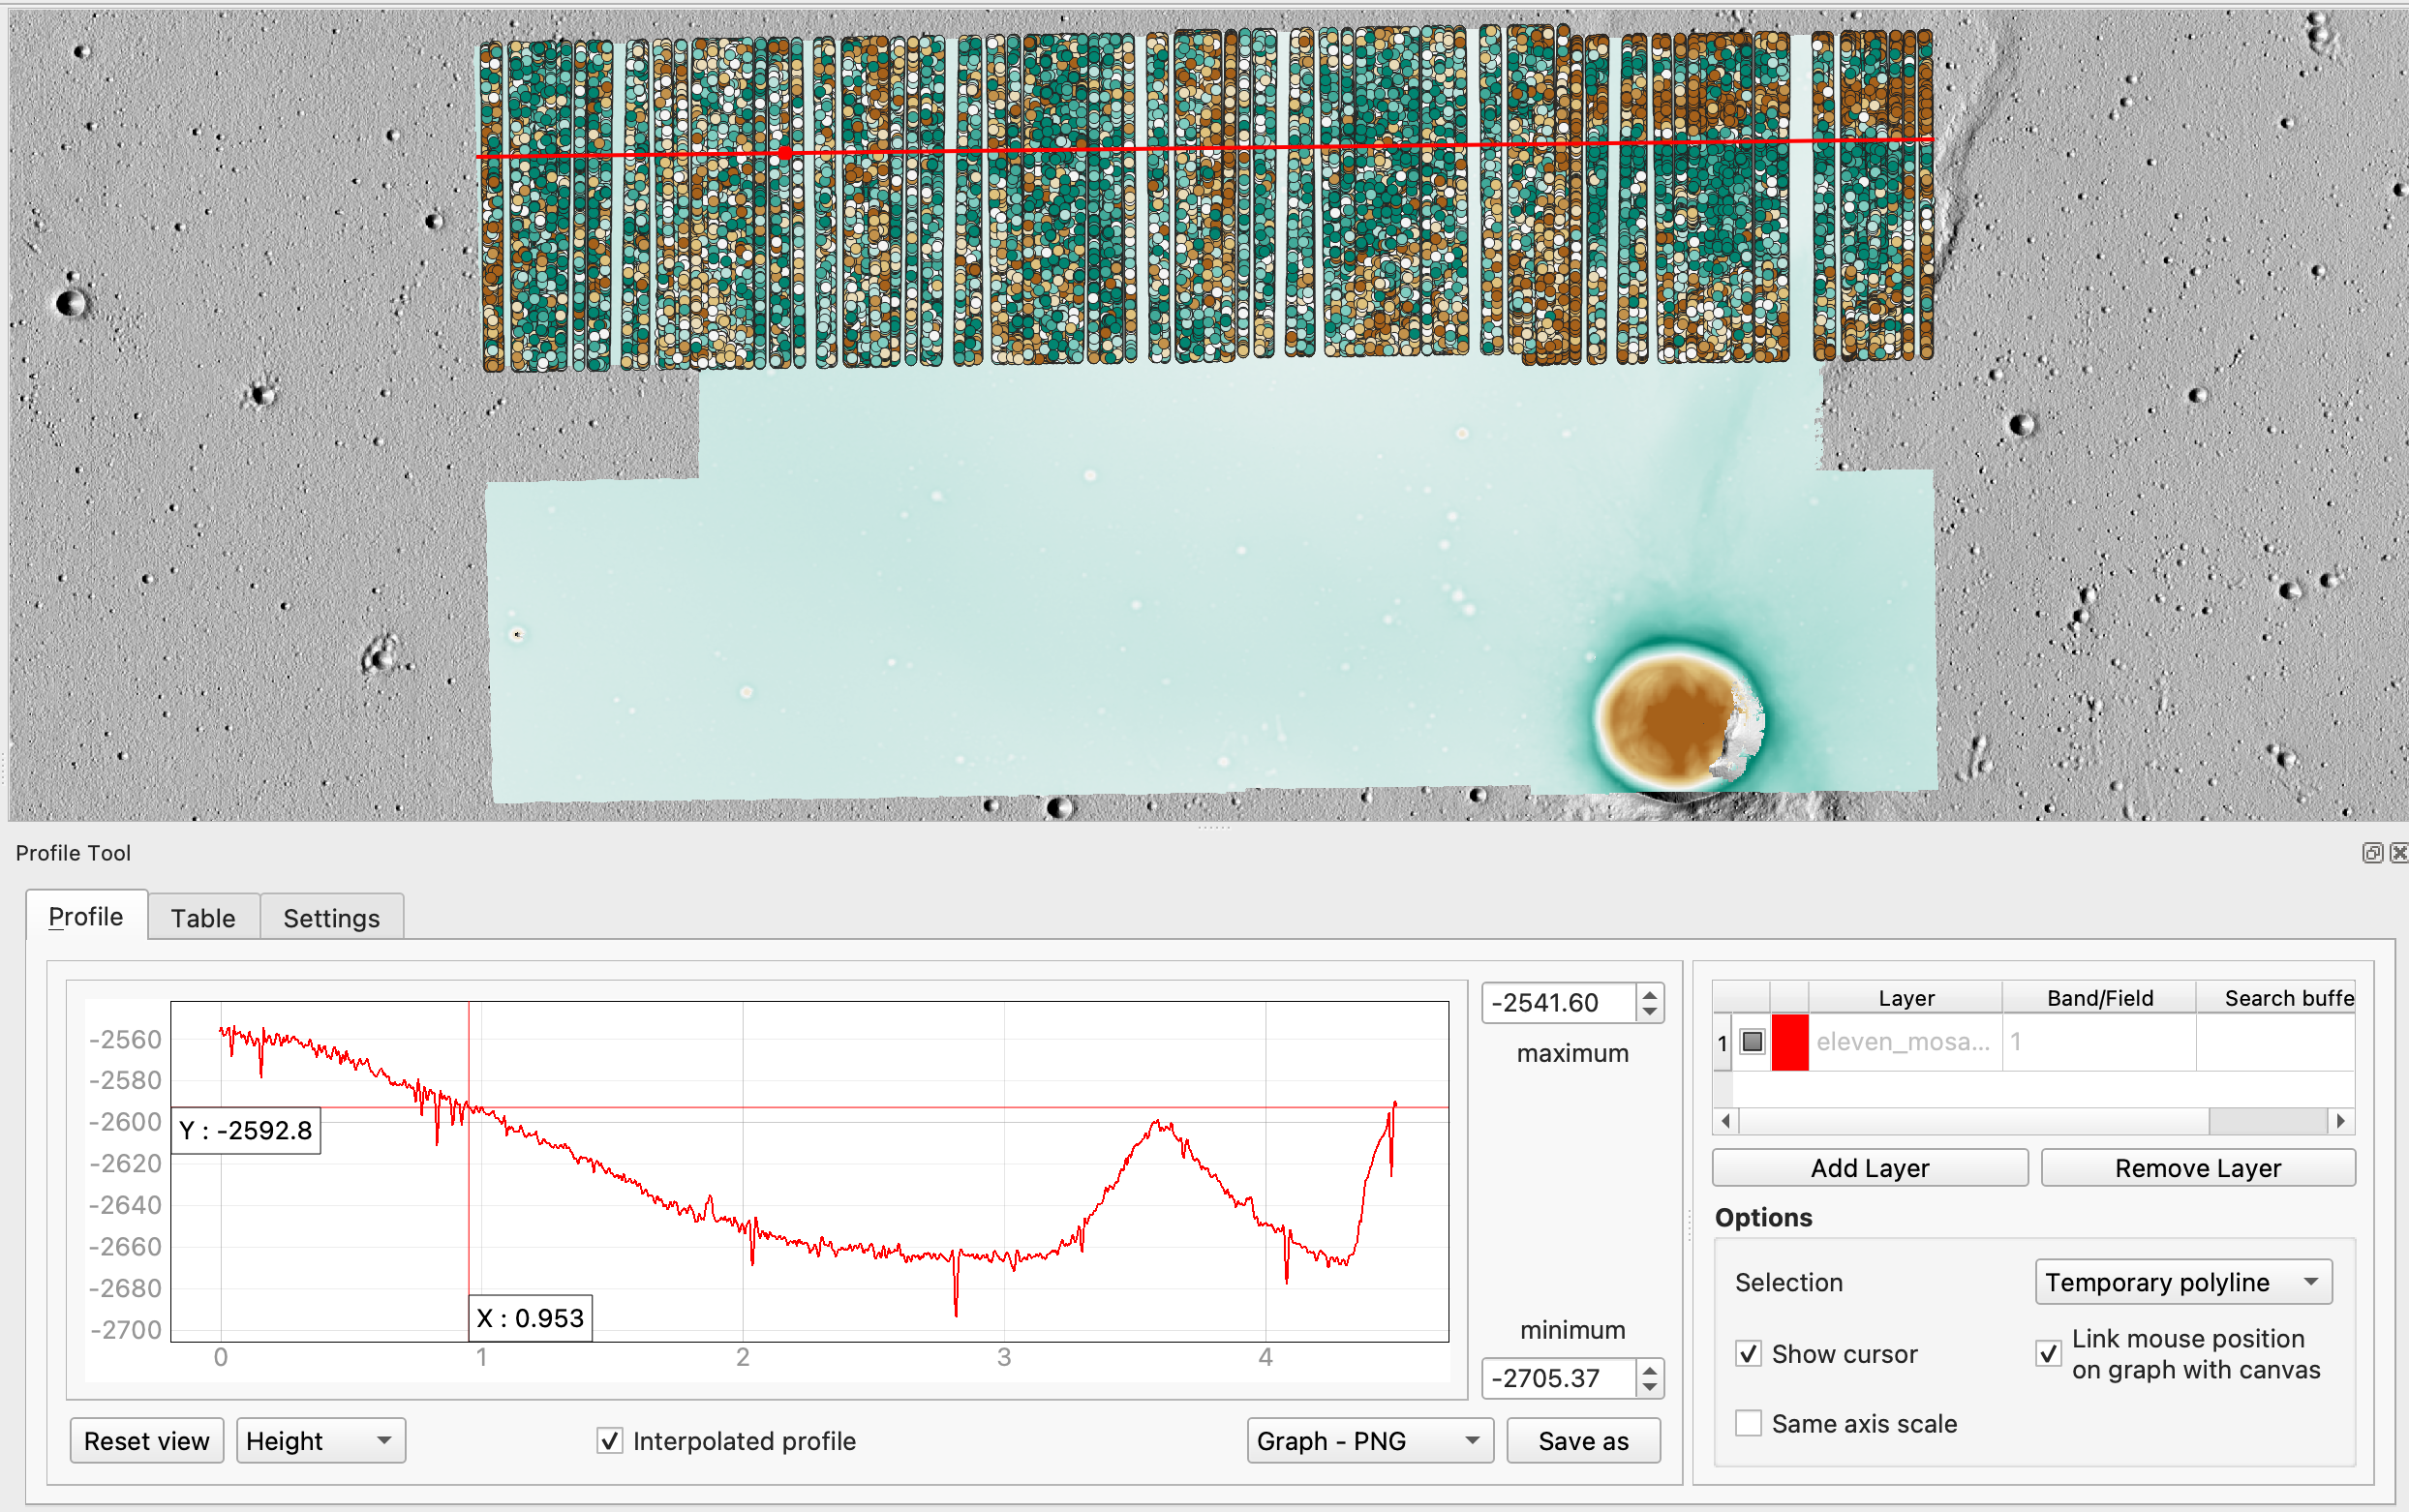
Eleven Kaguya TC DTMs with an across track transect showing no discernable offsets at DTM edges. The green and brown points show offsets to the LOLA DTM and appear to be correlated not with the image center or edges, but rather with high relief. This demonstrates that the updated sensor intrinsics are modeling sensor distortion better than the original distortion parameters.
The DTMs were generated using a five-step process and the NASA Ames Stereo Pipeline. First, data were ingested and USGSCSM sensor model was created for each observation. These sensor models use the updated sensor intrinsics. Next, each stereopair was bundle adjusted and a low-resolution DTM was created. Third, the low-resolution DTM and updated sensor ephemerides (from the previous bundle adjustment) were used to map project each image in the stereo pair and full-resolution stereo extraction was performed. Next, the full-resolution point cloud was aligned to the LOLA point cloud using a multi-step process that estimated the maximum allowable displacement and updated the absolute position of the full-resolution DTM relative to LOLA. Fifth, the point cloud and computed adjustment for alignment to LOLA were used to generate the released DTM and estimate quality statistics.
Alignment to LOLA was performed using a four-step process. First, we extract the LOLA point cloud from our released LOLA ARD using the approximate DTM footprint and a small buffer. This results in a LOLA point cloud, in CSV format, that can be used for alignment. Second, we perform an alignment, setting the maximum displacement to three times the median offset between the ASP-derived point cloud and the LOLA point cloud. Next, if that iteration raises warnings that the estimated maximum displacement is more than the provided maximum displacement, we run a second adjustment where the maximum displacement is set to the maximum displacement estimated by the previous tool run. Fourth, after the initial gross adjustment is estimated, we then perform a final alignment using the Fast Global Registration algorithm. This final adjustment makes small tweaks to the overall position of the DTM.
- JPEG thumbnail browse image generated from the DTM hillshade
- Digital Terrain Model (DTM) with units in meters reporting height above the sphere (note that these DTMs are not geoid adjusted), as a Cloud Optimized GeoTIFF (COG)
- Hillshade, as a Cloud Optimized GeoTIFF (COG)
- An ASP generated intersection error raster showing the triangulation error in the point cloud, as a Cloud Optimized GeoTIFF (COG)
- Orthoimage using the left observation from the stereopair, provided at the resolution of the DTM, as a Cloud Optimized GeoTIFF (COG)
- LOLA comma separated value (CSV) file with latitude, longitude, and radius (meters) that was used for the alignment of the point cloud to LOLA
- An ASP generated quality assurance CSV, the output from the geo_diff tool, showing the point-by-point offsets computed, after alignment, between the ASP generated point cloud and LOLA
- A Provenance file that tracks the processing done during the creation of the product
The horizontal accuracy issues present in the Kaguya TC observations caused by uncertainties in the ephemerides are largely corrected in this data set. The alignment of the DTMs to LOLA has absolutely adjusted the horizontal and vertical positions of the DTMs and the DTM-derived orthoimages. The quality assurance descriptive statistics describe the alignment to LOLA though users are cautioned the alignment does a terrific job mean centering the error near zero. Therefore, the latitude, longitude, and offset error points in the QA metrics file should be visualized in a GIS to see the spatial distribution of error and to assess whether a sub-region within the DEM is appropriate for the given use case.
As described above the DTMs are aligned to LOLA. Post alignment, the ASP geodiff tool was used to compute the absolute offsets to the provided LOLA point cloud. The estimated mean vertical offset to LOLA at the 99th percentile is 11 centimeters and the median vertical offset at the 99th percentile is 4 centimeters. We do see large potential blunders in a subset of DTMs with a maximum mean vertical offset of 7000 meters and a minimum vertical offset of -1811 meters. For these reasons, users of these DTMs should visualize the error metric files in a GIS.
Next, several regions of interest, composed of dozens of overlapping DTMs were created. The figure at the start of this document is an example of one of these regions of interest. The individual DTMs in these regions overlap by hundreds of meters across track (E/W). The vertical precision of the DTMs was estimated by spot-checking the elevations in areas of overlap to sample the absolute differences. In other words, the height at a given point, covered by two or more DTMs, was measured and the difference between each DTM was recorded. There is an average 2-5 meter offset between DTMs which is assessed to be within the expected error budget (i.e., resolution at higher precision using the techniques employed is not feasible).
Finally, averaged observation mosaics, at the mean 26 meters per pixel resolution, were created using the derived orthoimages. The apriori and final position of the orthoimages were assessed to determine the accuracy of the horizontal alignment. Orthoimages (and therefore DTMs) are assessed to have a horizontal precision inside an orthoimage pixel. In other words, the maximum horizontal error is less than 26 meters. See the figure below.
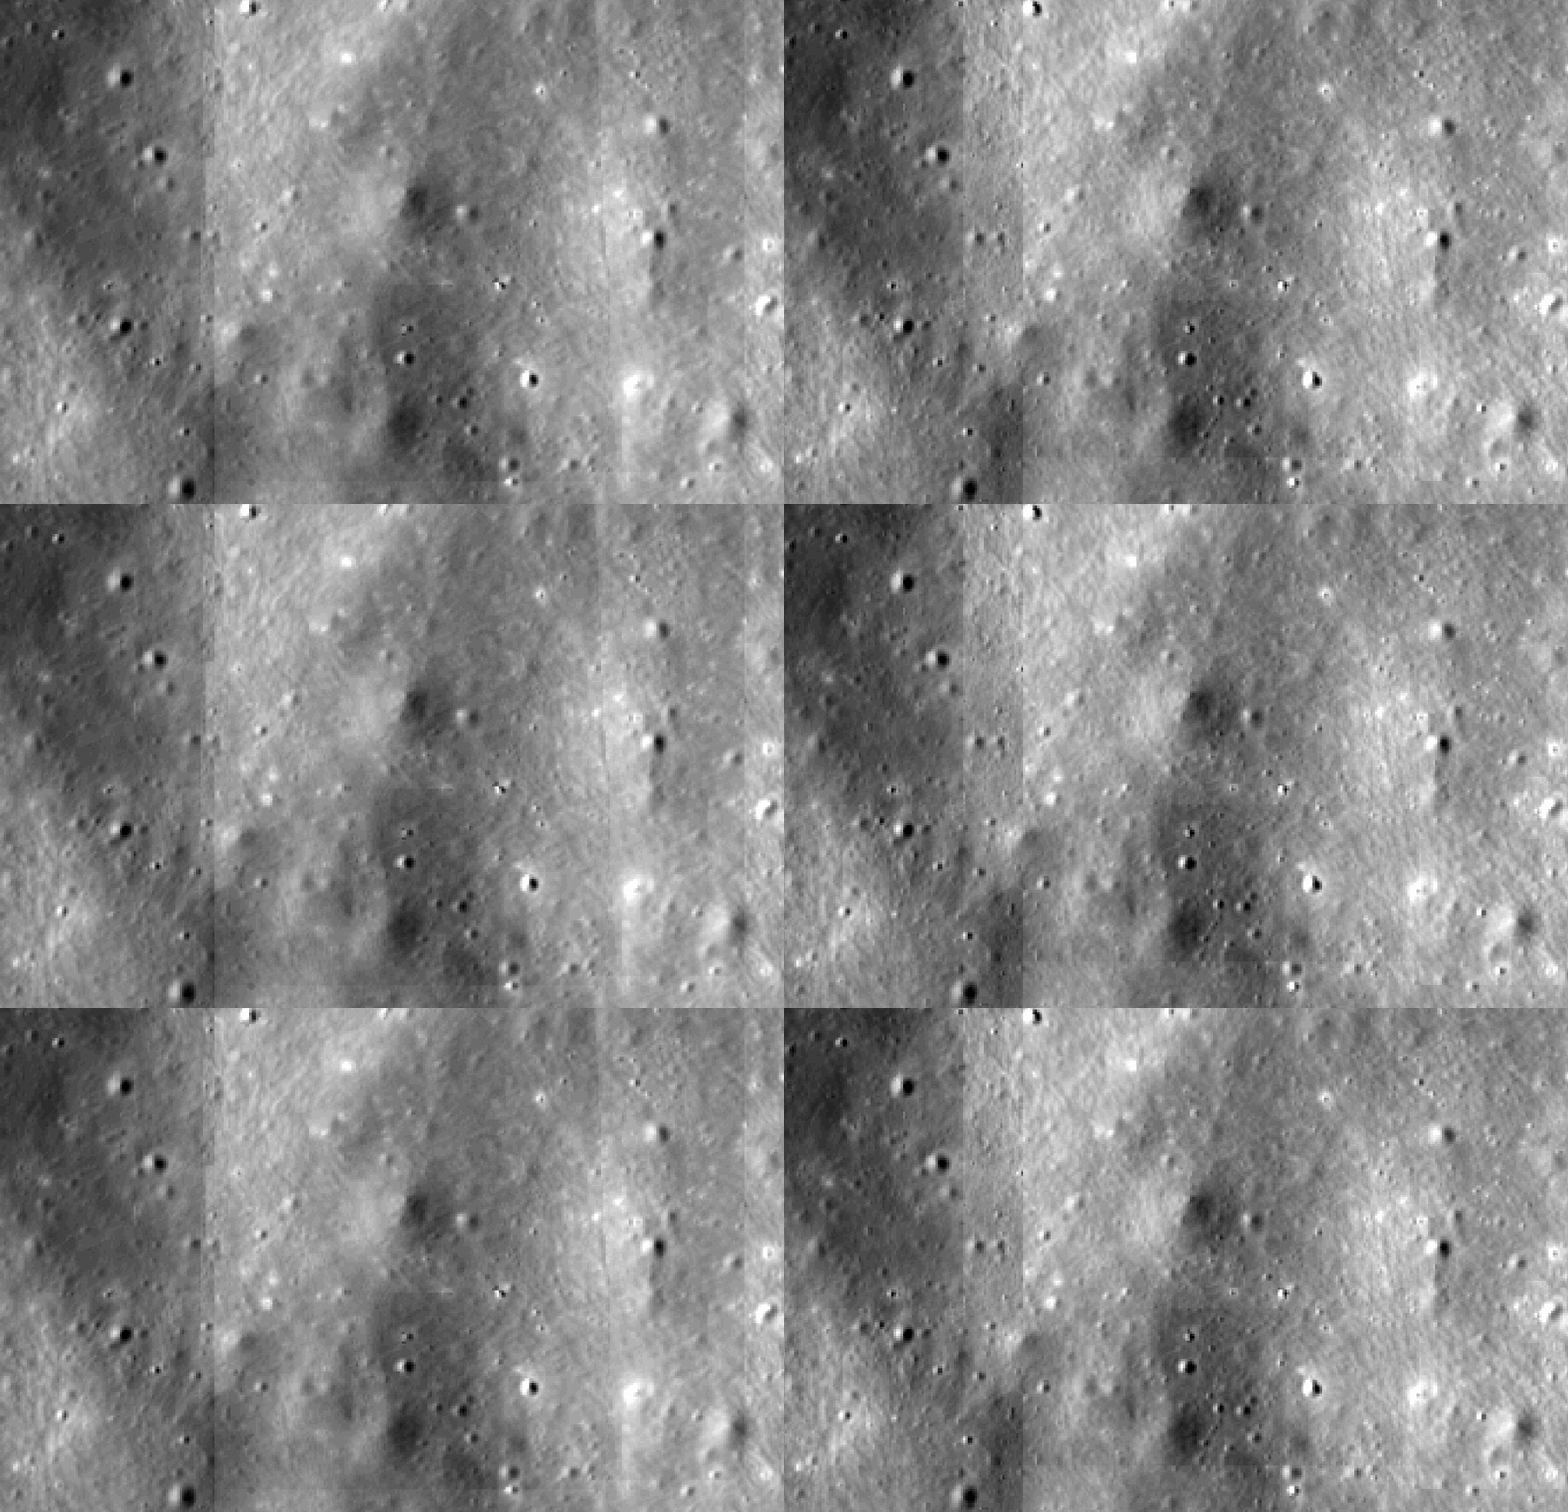
A GIF showing Kaguya TC orthoimages (~30 meters per pixel) using the IK defined sensor model intrinsics (blurred) and using our updated intrinsics (not blurred). Each pixel in the mosaic is an average of all contributing orthoimages; misalignment manifests as blurring.
Subsequent photogrammetric control using the at-resolution data (averaging 9 meters per pixel) resulted in average adjustments of less than 2 pixels suggesting that these data are horizontally precise to within 18 meters. The GIF, below, shows the improved horizontal alignment after updating the sensor intrinsics.
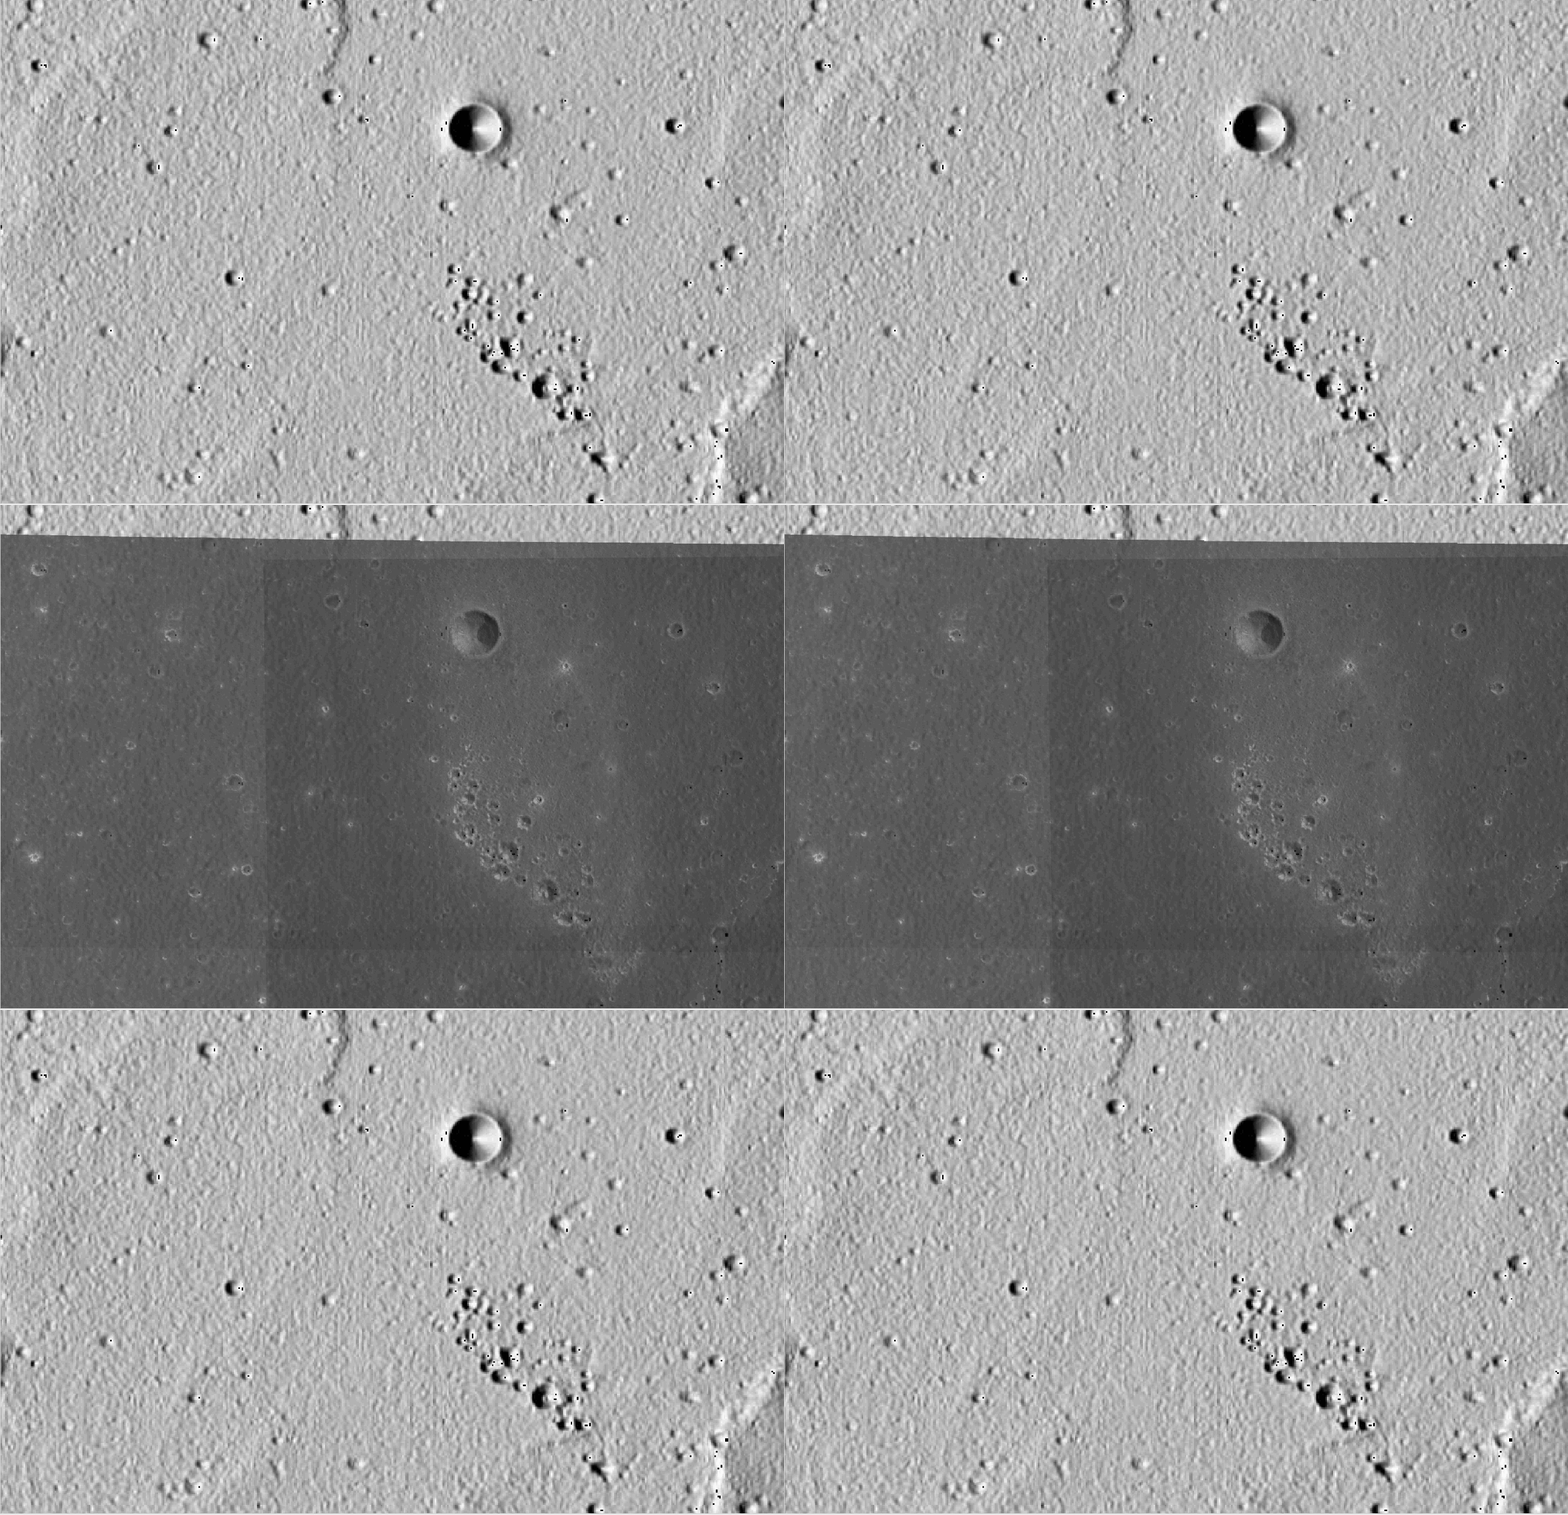
A GIF showing an at resolution, absolutely controlled average mosaic (where misalignment manifests as blur) using the LOLA alignment sensor ephemerides over a USGS produced Kaguya Terrain Camera hillshade derived from the Kaguya TC/LOLA merge DTM product (that was independently created by another team at an earlier date). The average shift is approximately one pixel or 9 meters. This indicates that the DTMs and orthoimages have subpixel horizontal precision.
Users of these data are encouraged to explore the CTX DTM documentation that describes more general issues that exist in DTMs such as blunders.
These data provide medium-resolution, near-global topographic coverage of the lunar surface with absolute alignment to LOLA. Users of the data should be aware of the quantitative accuracies and precisions described above. The following qualitative aspects of the data should also be considered.
First, a range of artifacts can be present in these DTMs. Therefore, users are encouraged to derive shaded-relief (hillshade) images at varying illumination angles, including but not limited to the same sun angle as the accompanying orthoimage and a low (barely above the horizon) angle that highlights subtle errors. These products will highlight blunders in the DTM that may influence the analysis being performed.
Next, long baseline errors in DTMs with seemingly good absolute alignment to LOLA can be present. These errors are not as pronounced as those in longer along-track DTMs (e.g., HiRISE or LRO NAC), but can still be present. Users should visualize the quality assurance metrics file provided with each DTM and assess the absolute alignment to LOLA for their use case as it varies spatially over the product. A DTM with low mean error can be tilted over the DTM baseline; the alignment transformation applied is rigid.
Third, when correcting for the sensor model intrinsics, we identified jitter in the spacecraft ephemerides. Jitter in the spacecraft position manifests as washboarding in the derived DTM. We see this jitter numerically in the intersection error rasters but do not see widespread washboarding like one finds in many MRO CTX DTMs. Still, users are cautioned to visualize the intersection error raster, checking for across-track linear trends, and then assessing the impact (or lack thereof) of the jitter on their analysis.

ASP generated intersection error rasters showing jitter (red; higher error) in multiple Kaguya TC stereopairs after triangulation. Input data have used our updated sensor model intrinsics and have been bundle adjusted prior to stereo extraction.
Fourth, two systematic errors still exist in these version 1.0 DTMs. The evening captured observations, with a full swath width (4096 pixels), still contain a systematic offset to LOLA at the DTM center. We are working to correct that error now. Second, the DTMs contain jitter, which is hard to detect in the hillshades and orthoimages, but easily visible in the intersection error rasters. Again, we are working on correcting this in an upcoming version 1.1 release.
Finally, one should compare the DTM to the provided orthoimage and, if so inclined, to the at-resolution Kaguya TC observations](kaguyatc.md) to identify and detect blunders. It is likely that the larger the spatial scale (smaller the region of interest) the more impactful small blunders that are detectable in the visible observations can be.
Two analysis-ready data sets are available that directly relate to these DTMs. First, the Kaguya TC ARD stereoscopic observations provided the input data used to derive these DTMs. The Kaguya TC ARD will not co-register with these data because these DTMs have been aligned to LOLA. The Kaguya TC DTM do provide essential, at-resolution, observations that are another tool to assess the resolving power of these DTMs. Next, the LOLA ARD provides a single, global lunar laser altimeter data set. These data were used to align the Kaguya TC DTMs and can be used to derive additional, lower-resolution, models of the lunar surface. Finally, a wide variety of other lunar data sets can be used in conjunction with these data. The Kaguya / SELENE spacecraft also flew the Multiband-Imager (MI) and Spectral Profiler (SP) instruments. These data sets offer multi- and hyper-spectral observations of the lunar surface with varying swath widths.
These data are released under the CC0-1.0 license , meaning you can copy, modify, and distribution these data without permissions. We ask that you cite these data if you make use of them. The citation to be used is:
Laura, J.R., Alexandrov, O., Adoram-Kershner, L., Bauck, K., Wheeler, B., Hare, T.M. 2024. Kaguya Terrain Camera, USGS Processed DTMs Analysis Ready Data Release. https://doi.org/10.5066/P13D7VMG
Please also consider citing the source data, provided by JAXA via DARTS .
- Kirk, R., Howington-Kraus, E., Rosiek, M., Anderson, J., Archinal, B., Becker, K., Cook, D., Galuszka, D., Geissler, P., Hare, T., Holmberg, I., Keszthelyi, L., Redding, B., Delamere, W., Gallagher, D., Chapel, J., Eliason, E., King, R. & McEwen, A. (2008). Ultrahigh resolution topographic mapping of Mars with MRO HiRISE stereo images: Meter-scale slopes of candidate Phoenix landing sites. Journal of Geophysical Research: Planets, 113(E3). https://doi.org/https://doi.org/10.1029/2007JE003000
- Kirk, R., Fergason, R., Redding, B., Galuszka, D., Smith, E., Mayer, D., Hare, T. & Gwinner, K. (2020). Evaluating Stereo DTM Quality at Jezero Crater, Mars With HRSC, CTX, and HiRISE Images. The International Archives of the Photogrammetry, Remote Sensing and Spatial Information Sciences, XLIII-B3-2020. 1129–1136. https://doi.org/10.5194/isprs-archives-XLIII-B3-2020-1129-2020

