

Mars ASP Generated CTX DTMs and Orthoimages
These data can be accessed in three ways:
The Mars Reconnaissance Orbiter (MRO) Context Camera (CTX; ( Citation: Malin, Bell III & al., 2007 Malin, M., Bell III, J., Cantor, B., Caplinger, M., Calvin, W., Clancy, R., Edgett, K., Edwards, L., Haberle, R., James, P., Lee, S., Ravine, M., Thomas, P. & Wolff, M. (2007). Context Camera Investigation on board the Mars Reconnaissance Orbiter. Journal of Geophysical Research: Planets, 112(E5). https://doi.org/https://doi.org/10.1029/2006JE002808 ) ) began operations in 2006. It is a “pushbroom” imager that acquires images one line at a time as the spacecraft moves in its orbit around Mars, taking tens of seconds for a typical image. The CCD detector is 5,000 pixels wide and the images have a scale of approximately 6 m/pixel in the MRO mapping orbit. The MRO is in a near-polar orbit, so the orbit tracks are almost oriented south-north. Thus, individual CTX images are approximately 30 km wide (approximately east-west, except near the poles) and range in length from tens to hundreds of km. CTX images cover nearly 100% of Mars’ surface, often more than once to acquire stereoscopic coverage or to search for changes on the surface (stereo pairs). Stereo pairs are pairs of images acquired on different orbits and with different viewing angles, but with similar lighting, allowing the images to be matched automatically.
Stereo pairs of CTX images can be used to determine the surface topography at much higher resolution than global data sets through the production of local-scale topographic models known as Digital Terrain Models (DTMs). DTMs can be used to study the heights and slopes of surface features for a variety of science applications.
These CTX DTMs were generated using the Ames Stereo Pipeline (ASP; {{ cite “Beyer:2018ess” >}}; 10.5281/zenodo.7497488) from a subset of CTX images collected concurrently with acquisition of stereopairs by the High Resolution Imaging Science Experiment (HiRISE). Each CTX DTM covers the area of overlap of two CTX images with a post spacing of 20 meters. They have been aligned to Mars Orbiter Laser Altimeter (MOLA) individual shot tracks ( ( Citation: Smith, 2003 Smith (2003). Mars Global Surveyor Laser Altimeter Precision Experiment Data Record. NASA Planetary Data System, MGS-M-MOLA-3-PEDR-L1A-V1.0. https://doi.org/https://doi.org/10.17189/1519520 ) ). Data is not written out for pixels where the ASP was unable to produce a good topographic solution, resulting in holes and ragged edges in the output DTM. Each CTX DTM gives elevation values above or below the Mars geoid (referred to as the areoid) and is presented in a simple cylindrical projection. Due to the small size of the DTMs, geometric distortion in this projection is small at low latitudes.
The DTMs also allow production of orthorectified images with minimized geometric distortion. These are also available on this site. It is usually advisable to use a DTM jointly with orthoimages produced from the same data, which show more detail about surface features and can also be used to help understand possible DTM artifacts.
MRO CTX stereo images used here are those collected concurrently with HiRISE stereo image data acquisition. These image pairs were acquired at times with similar lighting on the Martian surface but were taken from different angles. The similar lighting is important to make it possible to automatically match up parts of the two images; the different viewing angles matter because this is what creates the parallax that allows heights to be calculated. Data processing occurs in three general phases: (1) ingestion and pre-processing using the USGS Integrated Software for Imagers and Spectrometers ( ISIS v6.0.0 ; 10.5281/zenodo.5347823), (2) DTM generation using the ASP, and (3) analysis-ready data preparation using GDAL. Here, we describe each step in greater detail.
CTX Experiment Data Record data (the basic outputs from the camera, archived with the Planetary Data System or PDS) are ingested into ISIS using the mroctx2isis application. Then spicefit and spiceinit are run to obtain sensor ephemeris information for each image; these provide the initial estimates of where the camera was and where it was pointed as each image was acquired, which is essential information for determining the topography. Image data are calibrated using ctxcal and detector striping is removed with the evenodd application. These applications convert the raw output from the camera to ASP-compatible formats with physically meaningful I/F units.
In the second phase of the processing pipeline, the ASP is used to perform a pairwise bundle adjustment with the bundle_adjust function. This aligns the images and improves the estimate of the position and orientation of the cameras relative to one another. A point cloud (a collection of stereogrammetrically triangulated 3D locations) is then generated with the parallel_stereo function. To generate this point cloud, parallel_stereo uses an algorithm to match small patches in both images, and then uses the position and orientation of the camera (the parallax) to compute the ground elevation that allows those parts of the images to be in the same place. This point cloud is then aligned to MOLA using pc_align to make sure that the small-scale details fit the known topography at lower resolution. A DTM with a regularly spaced grid is extracted from the point cloud at 20 meters per post using point2dem. The DTM is then processed through dem_geoid to obtain heights above the equipotential Mars surface.
Finally, ASP generated GeoTIFFs are converted to cloud optimized GeoTIFFs (COGs) using GDAL’s gdal_translate application.
Assets available with these data are:
- Orthorectified images: Described elsewhere on this site.
- Hillshade images: Shaded-relief images derived from the DTM.
- “IntersectionErr”: Raster image of the intersection error. (See the ASP documentation for more information )
- Quality Assurance Metrics: Statistics for differences between the CTX and MOLA DTMs. (See
the
geodiffdocumentation for more information ) - Provenance information: Processing commands used to generate data.
- MOLA points used to control to ground in CSV format.
What are the quantitative things to be aware of and watch for?
The expected vertical precision of a stereo DTM depends on the image geometry and typical stereo matching error ( Citation: Kirk, Howington-Kraus & al., 2003 Kirk, R., Howington-Kraus, E., Redding, B., Galuszka, D., Hare, T., Archinal, B., Soderblom, L. & Barrett, J. (2003). High-resolution topomapping of candidate MER landing sites with Mars Orbiter Camera narrow-angle images. Journal of Geophysical Research: Planets, 108(E12). https://doi.org/https://doi.org/10.1029/2003JE002131 ; Citation: Kirk, Howington-Kraus & al., 2008 Kirk, R., Howington-Kraus, E., Rosiek, M., Anderson, J., Archinal, B., Becker, K., Cook, D., Galuszka, D., Geissler, P., Hare, T., Holmberg, I., Keszthelyi, L., Redding, B., Delamere, W., Gallagher, D., Chapel, J., Eliason, E., King, R. & McEwen, A. (2008). Ultrahigh resolution topographic mapping of Mars with MRO HiRISE stereo images: Meter-scale slopes of candidate Phoenix landing sites. Journal of Geophysical Research: Planets, 113(E3). https://doi.org/https://doi.org/10.1029/2007JE003000 ; Citation: Kirk, Mayer & al., 2021 Kirk, R., Mayer, D., Fergason, R., Redding, B., Galuszka, D., Hare, T. & Gwinner, K. (2021). Evaluating Stereo Digital Terrain Model Quality at Mars Rover Landing Sites with HRSC, CTX, and HiRISE Images. Remote Sensing, 13(17). https://doi.org/10.3390/rs13173511 ) and is expected to be around 3-5 meters for typical parameters for CTX DTMs. Errors can take a range of forms, not only random noise applied to the topography. The form of the most common issues is described in the next section.
Although the post spacing (ground sample distance, or GSD) of the DTMs is 20 meters, it is expected that the true resolution (in the sense of the scale of features that can be reliably seen and measured) is coarser: experiments comparing High Resolution Stereo Camera (HRSC) DTMs with much higher-resolution data suggest that the true resolution of the HRSC DTMs is 10–20 image pixels ( ( Citation: Kirk, Mayer & al., 2021 Kirk, R., Mayer, D., Fergason, R., Redding, B., Galuszka, D., Hare, T. & Gwinner, K. (2021). Evaluating Stereo Digital Terrain Model Quality at Mars Rover Landing Sites with HRSC, CTX, and HiRISE Images. Remote Sensing, 13(17). https://doi.org/10.3390/rs13173511 ) ), even though the DTMs (like these CTX DTMs) were extracted with a post spacing of 2–4 image pixels. ( Citation: Kirk, Mayer & al., 2021 Kirk, R., Mayer, D., Fergason, R., Redding, B., Galuszka, D., Hare, T. & Gwinner, K. (2021). Evaluating Stereo Digital Terrain Model Quality at Mars Rover Landing Sites with HRSC, CTX, and HiRISE Images. Remote Sensing, 13(17). https://doi.org/10.3390/rs13173511 ) also found that most 300-m craters were visible in a custom-produced 20 m/post CTX DTM but that many 150-m craters were not, and that small hills 50–70 m across were broadened in their CTX DTM. This level of accuracy is likely the best case for the DTMs in this data set since the automation of the process precludes optimizing each individual DTM. The quality of the DTM is also influenced by the quality of the input images and how well-matched their lighting and atmospheric conditions are.
The DTMs are aligned and controlled to ground using individual MOLA shot tracks. Quantitative comparisons of the aligned CTX DTM and MOLA data are given in the qa_metrics.txt file for each DTM. A perfect match is not expected given the different resolution of the two data sets. The laser altimeter shots have a 300 m along-track spacing, a large spatial footprint, and (near the equator) often a kilometer or more gap between adjacent tracks.
The qa_metrics.txt file for each DTM provides the maximum, minimum, mean, median, and standard deviation of the final CTX-MOLA differences after ground control. In general, it is desirable that all of these values be close to zero; however, the maximum and minimum differences are of less importance since they may be associated with outliers found at the edges of some DTMs or with places where steep local topography was not resolved well by MOLA. Large (many tens to hundreds of meters) values for the mean, median, and standard deviation of the difference are likely to indicate disagreement between CTX and MOLA that could indicate large-scale quality issues with the CTX DTM, while small values (a few meters) indicate good agreement with MOLA.
What are the qualitative things to be aware of and watch for?
There are a range of possible artifacts that may be encountered in DTMs. It is recommended to inspect the DTM and shaded-relief image to understand the quality. In some cases, it may be helpful to create your own shaded-relief images with a light source direction that exactly matches an orthoimage. Additionally, shaded relief with illumination from barely above the horizon can make subtle DTM features more obvious. Functions to create shaded relief images from DTMs are available in GIS software. We discuss the most common possible issues from the largest to the smallest scale.
At large scales, the most likely source of error is incorrect long-baseline topography or tilt due to imperfect alignment with MOLA. This can be subtle and hard to discern, but even a small long-baseline slope offset can result in large topographic errors when propagated over tens of kilometers. These effects can best be detected by comparing absolute elevations with the MOLA DTM or individual tracks and looking for spatial patterns. For instance, a long-baseline slope may appear as a systematic variation in the MOLA-CTX offset across the DTM. Additionally, large-scale patterns in the topography such as multi-kilometer hills and valleys with no obvious correspondence to visible topographic features may relate to poor control to MOLA. Looking at a topographic profile that covers the DTM from end to end can show these sorts of features.
At medium scales, the most likely issue affecting a CTX DTM is jitter. Jitter effects appear as a “washboard” pattern in the DTM. They are usually easiest to see in shaded relief at medium resolution and over smooth terrain; it may be hard to notice if zoomed all the way in, especially if there is a slope. This pattern results from high-frequency vibrations on the MRO spacecraft while one or both of the images were being acquired, which means that the camera was not pointed quite where expected from the ancillary pointing information while solving for the topography. The amplitude and wavelength of jitter may vary along an image depending on what perturbations were happening on the spacecraft. For instance, many HiRISE images are acquired in a high-stability mode that minimizes sources of vibration, so the amount of jitter in a CTX image taken at the same time may suddenly increase at the point where the smaller HiRISE observation finished.
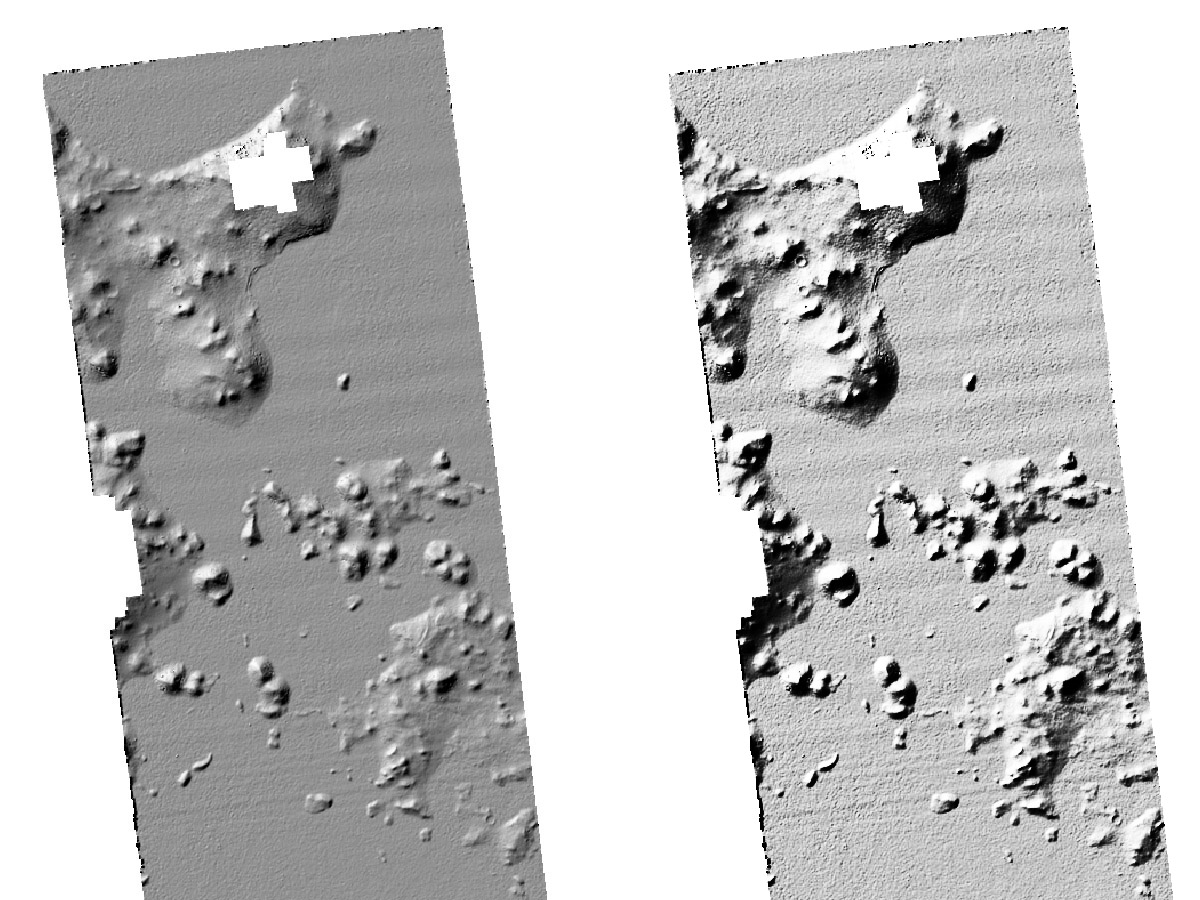
Example of jitter effects as seen in a shaded relief image for the D21_035270_1829_XI_02N199W__D20_035204_1829_XI_02N199W_DEM. Note the “washboard” ripples that run across the DTM, with a short wavelength near the bottom of the scene and a longer wavelength near the top. At left is the baseline stretch of the shaded relief image, whereas the version at right has been stretched to make the subtle effects of jitter more visible. Note that the jitter is only obvious in the parts of the DTM that are essentially flat, even though it is present and creates comparable amounts of error on the steeper terrain as well.
At short wavelengths there are several issues to watch for. Comparing an orthoimage with shaded relief images is the best way to reveal small-scale artifacts, which appear as topographic features in the shaded-relief image with no corresponding feature in the corresponding orthoimage. Common small-scale artifacts include localized, discrete pits and bumps due to matching blunders, as well as a pebbled texture that is often pervasive with a low amplitude of a few meters, consistent with the expected vertical precision. The latter provides a background level of “noise” in the topography.
Animated GIF: Comparison of the shaded-relief image and orthoimage for part of D21_035270_1829_XI_02N199W__D20_035204_1829_XI_02N199W_DEM. Note both local artifacts (bumps and pits) and the ubiquitous pebbled texture. The latter is usually low-relief and has little effect unless you are interested in slopes at short baselines, as it can be a significant source of error for those slopes.
If you are interested in small features, it is also a good idea to check whether they were effectively resolved in the DTM. Sometimes small-scale features may be smoothed out during the image matching process or be missed entirely. Small features may also be distorted even if they are visible, due to errors: a three-meter vertical error (typical expected precision for these DTMs) can seriously distort a ten-meter-high hummock but is a minor effect in a 100-m-deep crater. Additionally, since the point cloud that initiates the DTM is created by matching patches of images, small features may be slightly widened while having the extremes of the topography reduced.
Animated GIF: Comparison of the shaded-relief image and orthoimage for another part of D21_035270_1829_XI_02N199W__D20_035204_1829_XI_02N199W_DEM. The first part of the comparison shows examples of some small impact craters that were effectively resolved by the DTM. The second part shows craters that were partially resolved or not resolved at all. For partially resolved features, there does appear to be a feature in the DTM but it may not have the right depth or diameter, while the unresolved crater simply does not appear in the shaded relief. The final part of the comparison shows artifacts: features that are present in the DTM but not in the image.
DTMs may have gaps in areas where the stereo matching algorithm was unable to derive a good solution. These appear as “nodata” points and can range from small pinhole gaps to large swaths (often in rectangular tile shapes). Outlier points along the edge of the DTM or detached from the main DTM surface can also occur, with elevation values that are very discordant with the rest of the surface. These outlier points should not be used for measurements.
What should you do if you encounter one of these artifacts? It depends on the artifact and the topic that you are interested in, and should be considered on a case-by-case basis. For instance, even substantial long-baseline tilts usually do not have much effect on local topography, so you may be able to measure the height of a hill or depth of a crater, especially if you can correct for the tilt. Slope measurements will be off by up to the amount of the long-baseline tilt (depending on the direction), so a one-degree long-baseline slope will not have much effect on a steep crater wall. On the other hand, if you are interested in how a lava flow moved across the entire DTM, even subtle long-baseline slopes could cause important errors. Since the true long-baseline slope over the tens of kilometers covered by a typical CTX DTM is usually low, a subtle tilt may change its magnitude and direction meaningfully. In contrast, widespread noise like the pebbled textures shown above can cause inaccurate slope measurements at short baselines but usually averages out over longer scales. For example, a 3-meter topographic error could turn flat terrain into a 9º slope over a 20-m baseline but would only result in a <1º error over 200 m. It is always advisable to inspect the data and assess what kinds of errors may exist and whether the DTM is usable for your needs.
Though the user can operate around large-scale and systematic small-scale issues, no such option is available for small-scale discrepancies. Features that were not resolved in the DTM cannot be measured at all and artifacts that may locally create false features that should not be measured.
Since DTMs are controlled individually and the control process makes a best estimate of the alignment with MOLA in each case, adjacent (overlapping) DTMs are unlikely to line up perfectly. They are aligned independently with different parts of the MOLA data and the MOLA resolution is much lower. This can result in horizontal and vertical offsets and would appear as cliffs if the two or more DTMs were combined.
Orthorectified images associated with each DTM are available.
CTX data are often acquired simultaneously with higher-resolution observations from the High Resolution Imaging Science Experiment (HiRISE; ( Citation: McEwen, Eliason & al., 2007 McEwen, A., Eliason, E., Bergstrom, J., Bridges, N., Hansen, C., Delamere, W., Grant, J., Gulick, V., Herkenhoff, K., Keszthelyi, L., Kirk, R., Mellon, M., Squyres, S., Thomas, N. & Weitz, C. (2007). Mars Reconnaissance Orbiter’s High Resolution Imaging Science Experiment (HiRISE). Journal of Geophysical Research: Planets, 112(E5). https://doi.org/https://doi.org/10.1029/2005JE002605 ) ) and near-infrared spectral images from the Compact Reconnaissance Imaging Spectrometer for Mars (CRISM; ( Citation: Murchie, Arvidson & al., 2007 Murchie, S., Arvidson, R., Bedini, P., Beisser, K., Bibring, J., Bishop, J., Boldt, J., Cavender, P., Choo, T., Clancy, R., Darlington, E., Des Marais, D., Espiritu, R., Fort, D., Green, R., Guinness, E., Hayes, J., Hash, C., Heffernan, K., Hemmler, J., Heyler, G., Humm, D., Hutcheson, J., Izenberg, N., Lee, R., Lees, J., Lohr, D., Malaret, E., Martin, T., McGovern, J., McGuire, P., Morris, R., Mustard, J., Pelkey, S., Rhodes, E., Robinson, M., Roush, T., Schaefer, E., Seagrave, G., Seelos, F., Silverglate, P., Slavney, S., Smith, M., Shyong, W., Strohbehn, K., Taylor, H., Thompson, P., Tossman, B., Wirzburger, M. & Wolff, M. (2007). Compact Reconnaissance Imaging Spectrometer for Mars (CRISM) on Mars Reconnaissance Orbiter (MRO). Journal of Geophysical Research: Planets, 112(E5). https://doi.org/https://doi.org/10.1029/2006JE002682 ) ). Such coordinated observations can be particularly useful because the viewing geometry, surface illumination, and atmospheric conditions are the same. HiRISE and CRISM data are available from the PDS but the standard products have not been orthorectified at the scale of the CTX DTMs and orthoimages; therefore, they will not align precisely if they are imported into GIS software and there will be some geometric distortion of non-orthorectified data. Orthorectified HiRISE images may not align perfectly either as they are aligned to a different DTM.
These data are released under the CC0-1.0 license , meaning you can copy, modify, and distribution these data without permissions. We ask that you cite these data if you make use of them. The citation to be used is:
Laura, J.R., Adoram-Kershner, L.A., Meyer, D.P., Wheeler, B.H., Bauck, K.H. and Fergason, R.L., 2023. Mars Reconnaissance Orbiter (MRO) Context Camera (CTX) orthoimage generated using Ames stereo pipeline derived digital terrain models. https://doi.org/10.5066/P9JKVWR3
- Kirk, R., Howington-Kraus, E., Redding, B., Galuszka, D., Hare, T., Archinal, B., Soderblom, L. & Barrett, J. (2003). High-resolution topomapping of candidate MER landing sites with Mars Orbiter Camera narrow-angle images. Journal of Geophysical Research: Planets, 108(E12). https://doi.org/https://doi.org/10.1029/2003JE002131
- Kirk, R., Howington-Kraus, E., Rosiek, M., Anderson, J., Archinal, B., Becker, K., Cook, D., Galuszka, D., Geissler, P., Hare, T., Holmberg, I., Keszthelyi, L., Redding, B., Delamere, W., Gallagher, D., Chapel, J., Eliason, E., King, R. & McEwen, A. (2008). Ultrahigh resolution topographic mapping of Mars with MRO HiRISE stereo images: Meter-scale slopes of candidate Phoenix landing sites. Journal of Geophysical Research: Planets, 113(E3). https://doi.org/https://doi.org/10.1029/2007JE003000
- Kirk, R., Mayer, D., Fergason, R., Redding, B., Galuszka, D., Hare, T. & Gwinner, K. (2021). Evaluating Stereo Digital Terrain Model Quality at Mars Rover Landing Sites with HRSC, CTX, and HiRISE Images. Remote Sensing, 13(17). https://doi.org/10.3390/rs13173511
- Malin, M., Bell III, J., Cantor, B., Caplinger, M., Calvin, W., Clancy, R., Edgett, K., Edwards, L., Haberle, R., James, P., Lee, S., Ravine, M., Thomas, P. & Wolff, M. (2007). Context Camera Investigation on board the Mars Reconnaissance Orbiter. Journal of Geophysical Research: Planets, 112(E5). https://doi.org/https://doi.org/10.1029/2006JE002808
- McEwen, A., Eliason, E., Bergstrom, J., Bridges, N., Hansen, C., Delamere, W., Grant, J., Gulick, V., Herkenhoff, K., Keszthelyi, L., Kirk, R., Mellon, M., Squyres, S., Thomas, N. & Weitz, C. (2007). Mars Reconnaissance Orbiter’s High Resolution Imaging Science Experiment (HiRISE). Journal of Geophysical Research: Planets, 112(E5). https://doi.org/https://doi.org/10.1029/2005JE002605
- Murchie, S., Arvidson, R., Bedini, P., Beisser, K., Bibring, J., Bishop, J., Boldt, J., Cavender, P., Choo, T., Clancy, R., Darlington, E., Des Marais, D., Espiritu, R., Fort, D., Green, R., Guinness, E., Hayes, J., Hash, C., Heffernan, K., Hemmler, J., Heyler, G., Humm, D., Hutcheson, J., Izenberg, N., Lee, R., Lees, J., Lohr, D., Malaret, E., Martin, T., McGovern, J., McGuire, P., Morris, R., Mustard, J., Pelkey, S., Rhodes, E., Robinson, M., Roush, T., Schaefer, E., Seagrave, G., Seelos, F., Silverglate, P., Slavney, S., Smith, M., Shyong, W., Strohbehn, K., Taylor, H., Thompson, P., Tossman, B., Wirzburger, M. & Wolff, M. (2007). Compact Reconnaissance Imaging Spectrometer for Mars (CRISM) on Mars Reconnaissance Orbiter (MRO). Journal of Geophysical Research: Planets, 112(E5). https://doi.org/https://doi.org/10.1029/2006JE002682
- Smith (2003). Mars Global Surveyor Laser Altimeter Precision Experiment Data Record. NASA Planetary Data System, MGS-M-MOLA-3-PEDR-L1A-V1.0. https://doi.org/https://doi.org/10.17189/1519520