

Thermal Emission Imaging System (THEMIS) USGS Controlled Observations
The THEMIS controlled images were generated to correct mis-registrations between individual images using rigorous photogrammetric corrections. The 2001 Mar’s Odyssey Thermal Emission Imaging System (THEMIS) ( Citation: Christensen, Jakosky & al., 2004 Christensen, P., Jakosky, B., Kieffer, H., Malin, M., McSween, H., Nealson, K., Mehall, G., Silverman, S., Ferry, S., Caplinger, M. & Ravine, M. (2004). The Thermal Emission Imaging System (THEMIS) for the Mars 2001 Odyssey Mission. Space Science Reviews, 110(1). 85–130. https://doi.org/10.1023/B:SPAC.0000021008.16305.94 ) began operation in 2001, and covers nearly 100 percent of Mars’ surface and often several times. Also, over much of the Martian surface images have been acquired of the same location during different seasons or Mars years, allowing for the analysis of seasonal or inter-annual changes in surface features and atmospheric properties. The spacecraft’s near-polar orbit results in images that are oriented close to north-south and at a consistent local time and spatial resolution. These criteria make THEMIS images ideal for generating controlled products (Figure 1). Correcting the THEMIS image pointing through photogrammetric control allows these infrared images to be used to create seamless mosaics, accurately integrated with other data sets (such as topography or composition) and enables addressing more complex scientific questions.
Some use cases for THEMIS controlled images include (see also General Usability ) the following:
- Geologic context of a region of interest for more detailed analyses using higher resolution data sets (e.g., visible images, topography, compositional data).
- Basemaps for geologic, surface morphology, or other thematic mapping.
- Positional ground truth for registering other data sets or for assessing the offsets between another data set and the position of the Mars Orbiter Laser Altimeter (MOLA; the current ‘truth’).
- Analysis of seasonal or inter-annual changes in surface and atmospheric features.
- Nighttime images used as a unique dataset to gain insight into the physical properties of the surface.
- Additional processing to generate emissivity or de-correlation stretch (DCS) images for compositional analysis or thermal inertia.
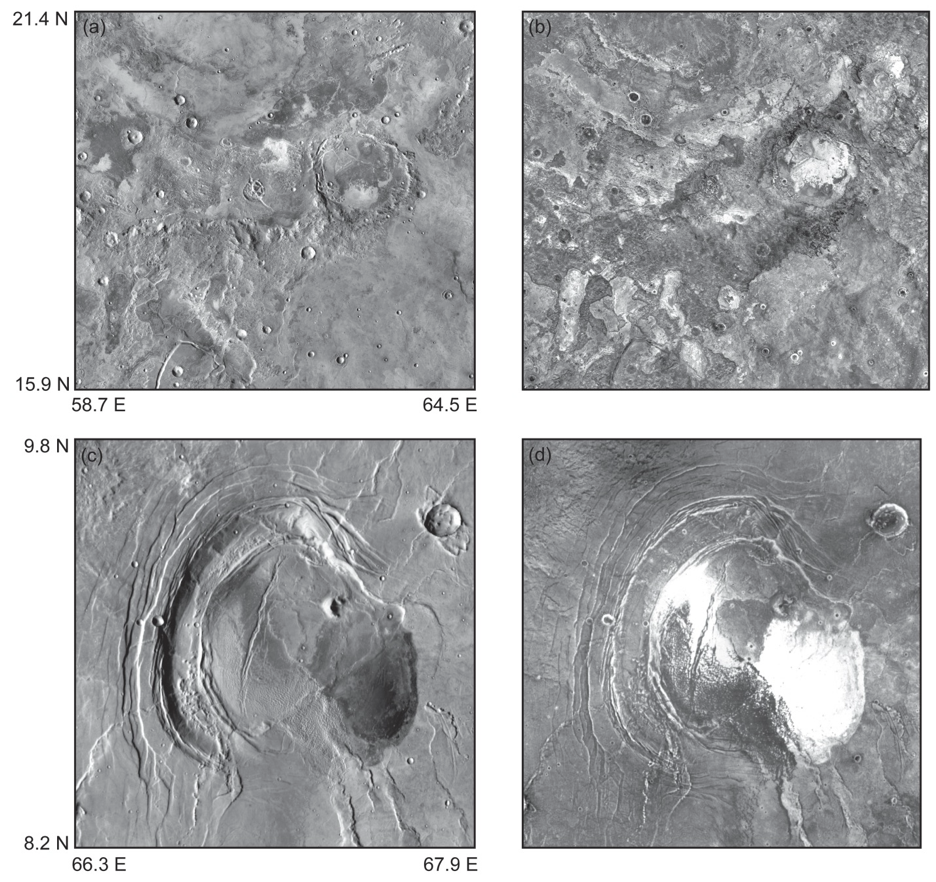
Figure 1: Syrtis Major mosaic example. The projection is simple cylindrical with a longitude domain of 0 to 360 degrees. (a) THEMIS daytime infrared (IR) controlled mosaic example. (b) THEMIS nighttime IR controlled mosaic example. (c) THEMIS daytime IR controlled mosaic of Nili Patera. (d) THEMIS nighttime IR controlled mosaic of Nili Patera.
The analysis ready THEMIS images are created from geodetically controlled THEMIS daytime infrared and nighttime images and the associated control network ( Citation: Fergason, Weller & al., 2026 Fergason, R., Weller, L. & Bland, M. (2026). The THEMIS Control Network of Mars. Earth and Space Science, 13(1). e2025EA004758. https://doi.org/https://doi.org/10.1029/2025EA004758 ) . These data are a foundational data product for Mars. The THEMIS control network is absolutely controlled to the Mars Orbiter Laser Altimeter (MOLA) ( Citation: Zuber, Smith & al., 1992 Zuber, M., Smith, D., Solomon, S., Muhleman, D., Head, J., Garvin, J., Abshire, J. & Bufton, J. (1992). The Mars Observer laser altimeter investigation. Journal of Geophysical Research: Planets, 97(E5). 7781–7797. https://doi.org/https://doi.org/10.1029/92JE00341 ; Citation: Smith, Zuber & al., 2001 Smith, D., Zuber, M., Frey, H., Garvin, J., Head, J., Muhleman, D., Pettengill, G., Phillips, R., Solomon, S., Zwally, H., Banerdt, W., Duxbury, T., Golombek, M., Lemoine, F., Neumann, G., Rowlands, D., Aharonson, O., Ford, P., Ivanov, A., Johnson, C., McGovern, P., Abshire, J., Afzal, R. & Sun, X. (2001). Mars Orbiter Laser Altimeter: Experiment summary after the first year of global mapping of Mars. Journal of Geophysical Research: Planets, 106(E10). 23689–23722. https://doi.org/https://doi.org/10.1029/2000JE001364 ) digital elevation model, and images in this network are orthographically projected and have a spatial scale of 100 m/pixel over the ±65˚ latitude region of Mars. These products enhance our knowledge of image placement (position, precision, and accuracy) and the location of small-scale surface features.
Daytime infrared images resemble visible images because surface topography is a large factor in the surface radiance or temperature during the day. For example, cooler areas being shaded by local topography and not exposed to direct sunlight mimic shadowed areas observed in visible images and are often the same surfaces. Surface albedo is a second factor in determining surface radiance or temperature during the day. Darker surfaces in visible images – such as dark sand – will absorb more of the sun’s energy during the day. This additional absorption relative to surrounding surfaces results in a higher pixel value and will appear “brighter” in daytime infrared images.
On the other hand, nighttime infrared images provide a unique view of the Martian surface. On Mars, surface radiance or temperature at night is controlled by the conductivity of surface materials themselves and the rate at which the surface emits infrared energy that was absorbed during the previous day. Generally, finer-grained materials (e.g., loose dust, silt, or fine-grained sand) release energy very quickly and will have a lower pixel value, or appear “darker”, at the pre-dawn times these nighttime images were acquired. Bedrock, ice (at higher Martian latitudes, and not typically observed at the latitudes included in this catalog), or indurated materials release energy more slowly and have a higher pixel value, or “brighter” appearance, at night.
THEMIS infrared data are acquired using a multispectral microbolometer array with 320 cross-track pixels and 240 down-track pixels. Thus, the smallest THEMIS image that can be acquired contains 240 rows. However, the THEMIS instrument is commanded such that images longer than 240 rows are typical, and that image length can be customized to meet the goals of the observation. It has an instantaneous field of view (IFOV) of ~100 m per pixel and an image width of ~32 km. Spectral differentiation in the infrared is achieved with ten narrowband stripe filters that produce ~1-μm wide bands at nine separate wavelengths from 6.78 to 14.88 μm (Table 1). These bands include nine (9) surface-sensing wavelengths (bands 1-9), and one atmospheric wavelength (band 10) ( Citation: Christensen, Jakosky & al., 2004 Christensen, P., Jakosky, B., Kieffer, H., Malin, M., McSween, H., Nealson, K., Mehall, G., Silverman, S., Ferry, S., Caplinger, M. & Ravine, M. (2004). The Thermal Emission Imaging System (THEMIS) for the Mars 2001 Odyssey Mission. Space Science Reviews, 110(1). 85–130. https://doi.org/10.1023/B:SPAC.0000021008.16305.94 ) . Two filters (bands 1 and 2) cover the same wavelength range (centered at 6.78 μm) to improve the signal to noise in that spectral region. Standard THEMIS data processing consists of decompression, radiometric calibration, systematic noise removal, and were applied to these images ( Citation: Christensen, Jakosky & al., 2004 Christensen, P., Jakosky, B., Kieffer, H., Malin, M., McSween, H., Nealson, K., Mehall, G., Silverman, S., Ferry, S., Caplinger, M. & Ravine, M. (2004). The Thermal Emission Imaging System (THEMIS) for the Mars 2001 Odyssey Mission. Space Science Reviews, 110(1). 85–130. https://doi.org/10.1023/B:SPAC.0000021008.16305.94 ) . Images can also be geometrically corrected, and multiple images can then be mosaicked together.
| Band | Center Wavelength (µm) | Band Width (µm) (Full Width Half Max) | Signal-to-Noise Ratio |
|---|---|---|---|
| 1 | 6.78 | 1.01 | 33 |
| 2 | 6.78 | 1.01 | 34 |
| 3 | 7.93 | 1.09 | 104 |
| 4 | 8.56 | 1.16 | 163 |
| 5 | 9.35 | 1.20 | 186 |
| 6 | 10.21 | 1.10 | 179 |
| 7 | 11.04 | 1.19 | 193 |
| 8 | 11.79 | 1.07 | 171 |
| 9 | 12.57 | 0.81 | 132 |
| 10 | 14.88 | 0.87 | 128 |
| Table 1. THEMIS infrared band characteristics ( Citation: Christensen, Jakosky & al., 2004 Christensen, P., Jakosky, B., Kieffer, H., Malin, M., McSween, H., Nealson, K., Mehall, G., Silverman, S., Ferry, S., Caplinger, M. & Ravine, M. (2004). The Thermal Emission Imaging System (THEMIS) for the Mars 2001 Odyssey Mission. Space Science Reviews, 110(1). 85–130. https://doi.org/10.1023/B:SPAC.0000021008.16305.94 ) |
We generated separate control networks for the daytime and nighttime infrared images since these image products have a significantly different appearance and are often used for different scientific purposes ( Citation: Fergason, Weller & al., 2026 Fergason, R., Weller, L. & Bland, M. (2026). The THEMIS Control Network of Mars. Earth and Space Science, 13(1). e2025EA004758. https://doi.org/https://doi.org/10.1029/2025EA004758 ) . Our strategy for generating these controlled images was to create regional networks and then merge those regional networks together as they were built to establish a single solution. We incorporated all viable THEMIS infrared images into the control network that had been acquired when we began work on a given regional mosaic. Since the THEMIS instrument is still orbiting Mars and collecting data, not all THEMIS images are included in the control network (i.e., recently acquired images are not included). Images were also excluded from the network if they were of poor quality and the matching software or manual tie pointing methods were unsuccessful in obtaining match points. Often, and particularly at high latitudes and areas with a low thermal inertia surface, this poor image quality was due to cold surface temperatures resulting in a relatively low signal-to-nose ratio. Those images not included in the network do not have improved image information (i.e., smithed kernels.)
THEMIS controlled products correct for mis-registration between images and georeference the THEMIS mosaic to MOLA using rigorous photogrammetric techniques. The USGS Integrated Software for Imagers and Spectrometers (ISIS; https://github.com/USGS-Astrogeology/ISIS3 ) version 3.5.3 software suite was used to generate the THEMIS daytime infrared and nighttime infrared control networks. This multi-step process was iterative and required human oversight to identify and correct errors. Our process was specifically tailored for the THEMIS dataset and includes these steps:
- identify and download images from the Planetary Data System (PDS; https://pds-imaging.jpl.nasa.gov/volumes/ody.html);
- ingest the THEMIS images into ISIS and initialize the geometric information (I.e., SPICE initialization);
- obtain points and measures on images by using both existing points from adjacent tiles and creating new points and measures;
- subpixel register measures and evaluate registration quality;
- bundle adjust the network;
- evaluate high residual measures and network health;
- make appropriate adjustments and bundle-adjust the modified network;
- continue to iterate over bundle adjustment, evaluating network health, and modifying the network until image-to-image residuals are below sub-pixel accuracy;
- tie the completed network to ground;
- generate mosaics for visual inspection.
In the steps above, we generated the THEMIS infrared controlled mosaics by first running the ISIS program spiceinit to obtain sensor ephemeris information, which provides the initial estimates of where the camera was as it was orbiting Mars and where it was pointed as each image was acquired (steps 1-2). This information was the starting point for generating the controlled image products. Next, we used multiple image-to-image tie point methods to identify matching features in images (steps 3), sub-pixel-registered these features using the ISIS program pointreg and evaluated the registration quality (step 4). We then ran the ISIS bundle adjustment program jigsaw (step 5; Edmundson et al, 2012). A least-squares bundle adjustment of the network solved for the latitude, longitude, and radius uncertainties on each point in the control network, the uncertainties for the exterior orientation of the images (i.e., pointing of the spacecraft and position of each image), and uncertainties associated with these measurements. We also evaluated the network’s health, made appropriate adjustments and bundle adjusted the modified network. Finally, we continued to iterate over bundle adjustment, evaluating network health, and modifying the network until image-to-image residuals fell below sub-pixel accuracy (steps 6-8 above).
After image-to-image ties were completed, we then tied the THEMIS network to ground (step 9 above) using an improved Viking MDIM 2.1 network ( Citation: Archinal, Kirk & al., 2003 Archinal, B., Kirk, R., Duxbury, T., Lee, E., Sucharski, R. & Cook, D. (2003). Mars Digital Image Model 2.1 Control Network. ; Citation: Archinal, Weller & al., 2004 Archinal, B., Weller, L., Sides, S., Cushing, G., Kirk, R., Soderblom, L. & Duxbury, T. (2004). Preparing for Themis Controlled Global Mars Mosaics. ) . We chose Viking MDIM, rather than tying directly to MOLA, because it is challenging to register an image data set to altimeter shot points or topography information, as surface features may appear very different in each of these data sets. We also incorporated new data into the Viking MDIM 2.1 network. To take advantage of the high accuracy High/Super Resolution Stereo Camera (HRSC) ( Citation: Jaumann, Neukum & al., 2007 Jaumann, R., Neukum, G., Behnke, T., Duxbury, T., Eichentopf, K., Flohrer, J., Gasselt, S., Giese, B., Gwinner, K., Hauber, E., Hoffmann, H., Hoffmeister, A., Köhler, U., Matz, K., McCord, T., Mertens, V., Oberst, J., Pischel, R., Reiss, D., Ress, E., Roatsch, T., Saiger, P., Scholten, F., Schwarz, G., Stephan, K. & Wählisch, M. (2007). The high-resolution stereo camera (HRSC) experiment on Mars Express: Instrument aspects and experiment conduct from interplanetary cruise through the nominal mission. Planetary and Space Science, 55(7). 928–952. https://doi.org/https://doi.org/10.1016/j.pss.2006.12.003 ) data and the geometric strength of the global Viking MDIM 2.1, we reprocessed the original MDIM 2.1 network incorporating available HRSC level 4 data (which have been well controlled to the MOLA reference frame) as additional ground control. Error propagation showed that 80 percent of the final enhanced MDIM 2.1 solution tie points have horizontal accuracies better than 200 meters. This methodology results in a control network and an orthorectified product that we could use as an intermediate tie to MOLA.
Using this improved image pointing information, observations were processed generated using the Davinci software developed by Arizona State University ( http://davinci.asu.edu/index.php?title=Main_Page ) (step 10 above). These mosaics were generated following the procedure described in ( Citation: Edwards, Nowicki & al., 2011 Edwards, C., Nowicki, K., Christensen, P., Hill, J., Gorelick, N. & Murray, K. (2011). Mosaicking of global planetary image datasets: 1. Techniques and data processing for Thermal Emission Imaging System (THEMIS) multi-spectral data. Journal of Geophysical Research: Planets, 116(E10). https://doi.org/https://doi.org/10.1029/2010JE003755 ) . Using Davinci allowed us to incorporate post-processing image techniques developed by the THEMIS team (e.g., uddw, rtilt, deplaid, and blend) to reduce image noise and seams between images ( Citation: Edwards, Nowicki & al., 2011 Edwards, C., Nowicki, K., Christensen, P., Hill, J., Gorelick, N. & Murray, K. (2011). Mosaicking of global planetary image datasets: 1. Techniques and data processing for Thermal Emission Imaging System (THEMIS) multi-spectral data. Journal of Geophysical Research: Planets, 116(E10). https://doi.org/https://doi.org/10.1029/2010JE003755 ) . This process resulted in a seamless, blended, 8-bit, qualitative mosaic product.
For release as Analysis Ready Data observations were processed using the Arizona State University developed Davinci , THEMIS pre- and post-process scripts and ISIS. Footprints, camera statistics, and map projection are performed using ISIS. Davinic, depending on the observation time, performs dewobbling, deplaiding, detilting, and atmospheric correction. When processing is completed, the data are converted to losslessly compressed Cloud Optimized GeoTiffs and Spatio-Temporal Asset Catalog (STAC) metadata are generated.
Assets available for daytime data are:
- Brightness Temperature: Data converted to brightness temperature.
- Emissivity: Data converted to emissivity.
- MaxBTemp: Data converted to a single band maximum brightness temperature observation.
- Image thumbnail: Browse product.
- ISIS Label: The ISIS label from the input cube.
- PDS3 Label: The original PDS 3 label.
- Cam Info: The ISIS generated CamInfo PVL file for the observation.
- Provenance: Procesisng provenance.
Assets available nighttime data are:
- Brightness Temperature: Data converted to brightness temperature.
- Image thumbnail: Browse product.
- ISIS Label: The ISIS label from the input cube.
- PDS3 Label: The original PDS 3 label.
- Cam Info: The ISIS generated CamInfo PVL file for the observation.
- Provenance: Procesisng provenance.
These images have been visually inspected to identify mis-registrations between images and correct them by adding new points or removing poor quality images. We then continued to iterate over bundle adjustment, evaluating network health, and modifying the network until image-to-image residuals are below sub-pixel accuracy. The quality evaluation of the THEMIS daytime and nighttime control networks was based on the average bundle adjustment residuals and provides information about the quality of the image registration. In the uncontrolled data, we found that errors in image position at the 2-4-pixel level (but as large as 30 pixels) are common (Figure 2). The position of a single THEMIS image was most commonly adjusted by 2-7 pixels, which corresponds to 200-700 meters. These errors are primarily due to uncertainties in the THEMIS image start time. This uncertainty is random, and there are no current plans to improve the THEMIS infrared ephemeris data. Photogrammetrically controlling the THEMIS images has enabled the correction of these errors and improves both the registration between images and registration to a known coordinate reference frame (e.g., MOLA) at known levels of precision and accuracy. The registration between THEMIS images in these products is better than a single pixel (or 100 m).
We also created regional mosaics from these images and visually compared each mosaic to the MOLA hillshade to assess the registration between the THEMIS mosaics and the established Mars datum (or ground “truth”). In addition, we overlaid MOLA contours onto each controlled mosaic and verified that the contours represented the topographic variations observed in the THEMIS images using ESRI’s ArcMap software package. The THEMIS images are consistent with the MOLA topography at the scale of the THEMIS images (100 meters).
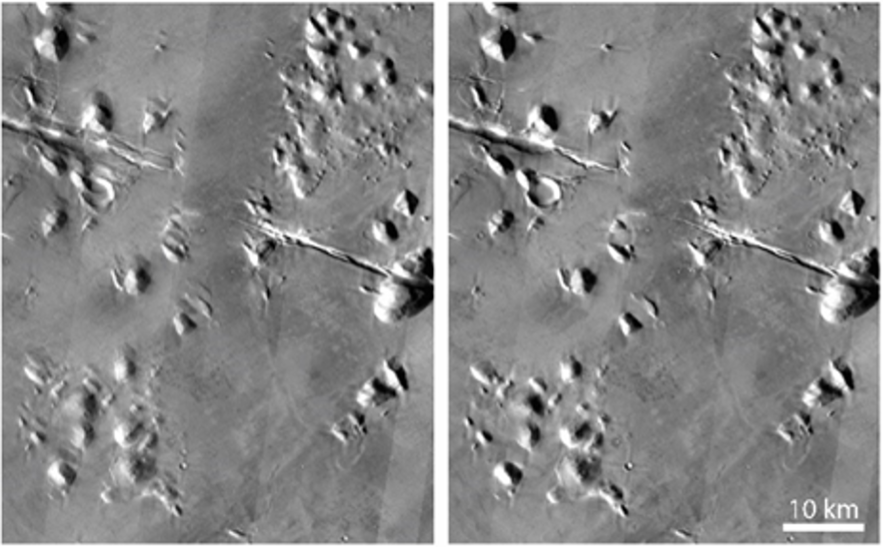
Figure 2: Comparison of uncontrolled (left) and controlled (right) image averaged mosaic products. Portion of the Elysium mosaic, 15.4° N, 162.4° E. The uncontrolled mosaic is blurry due to misalignment of the individual images that make up the mosaics. A 16-20-pixel shift was necessary to match features in this area. Once matched, the blur in the average mosaic is significantly reduced. The projection is simple cylindrical with a longitude domain of 0° to 360°.
Push-broom scanning systems, such as the THEMIS instrument, are susceptible to noise along scan-lines and detector-columns. Row- and column correlated noise is caused by small changes in both the detector response relative to the prelaunch response function and minor fluctuations in detector readout bias voltage ( Citation: Bandfield, Rogers & al., 2004 Bandfield, J., Rogers, D., Smith, M. & Christensen, P. (2004). Atmospheric correction and surface spectral unit mapping using Thermal Emission Imaging System data. Journal of Geophysical Research: Planets, 109(E10). https://doi.org/https://doi.org/10.1029/2004JE002289 ; Citation: Fergason, Christensen & al., 2006 Fergason, R., Christensen, P. & Kieffer, H. (2006). High-resolution thermal inertia derived from the Thermal Emission Imaging System (THEMIS): Thermal model and applications. Journal of Geophysical Research: Planets, 111(E12). https://doi.org/https://doi.org/10.1029/2006JE002735 ) . This noise is present as “stripes” in the vertical and horizontal directions due to variations of ±1 DN, and can make reliable analysis of small areas (~10x10 pixels) problematic ( Citation: Christensen, Jakosky & al., 2004 Christensen, P., Jakosky, B., Kieffer, H., Malin, M., McSween, H., Nealson, K., Mehall, G., Silverman, S., Ferry, S., Caplinger, M. & Ravine, M. (2004). The Thermal Emission Imaging System (THEMIS) for the Mars 2001 Odyssey Mission. Space Science Reviews, 110(1). 85–130. https://doi.org/10.1023/B:SPAC.0000021008.16305.94 ; Citation: Bandfield, Rogers & al., 2004 Bandfield, J., Rogers, D., Smith, M. & Christensen, P. (2004). Atmospheric correction and surface spectral unit mapping using Thermal Emission Imaging System data. Journal of Geophysical Research: Planets, 109(E10). https://doi.org/https://doi.org/10.1029/2004JE002289 ; Citation: Fergason, Christensen & al., 2006 Fergason, R., Christensen, P. & Kieffer, H. (2006). High-resolution thermal inertia derived from the Thermal Emission Imaging System (THEMIS): Thermal model and applications. Journal of Geophysical Research: Planets, 111(E12). https://doi.org/https://doi.org/10.1029/2006JE002735 ; Citation: Nowicki, Edwards & al., 2013 Nowicki, K., Edwards, C. & Christensen, P. (2013). Post-projection removal of row- and column-correlated noise in line-scanning data: Application to THEMIS infrared data. https://doi.org/10.1109/WHISPERS.2013.8080692 ) . The majority of detector-row and column correlated noise is removed during calibration using a windowed algorithm and utilizing information in the Instrument Response Function, but residual noise (dubbed “plaid”) and processing artifacts remain after the calibrated data has been projected. These artifacts can be readily viewed using decorrelation stretches or by numerically comparing radiance or emissivity differences in small regions ( Citation: Nowicki, Edwards & al., 2013 Nowicki, K., Edwards, C. & Christensen, P. (2013). Post-projection removal of row- and column-correlated noise in line-scanning data: Application to THEMIS infrared data. https://doi.org/10.1109/WHISPERS.2013.8080692 ) . A post-processing algorithm to remove this residual “plaid” has been applied to all images processed in this dataset. However, this algorithm does not remove all evidence of row- and column-correlated noise in all instances, and this noise may still be present. See figure 3 (more subtle and common) and figure 4 (more pronounced) for examples.
Whether images containing residual “plaid” should be used for scientific analysis depends on the analysis being performed and the degree of quantitative temperature or emissivity accuracy that is required. Subtle plaid (Figure 3) may be quite suitable for investigation, and particularly for surface feature mapping or qualitative assessments. More significant “plaid” (Figure 4) is an indication of uncorrected noise in the image, is often accompanied by other data concerns (see pixel saturation below), and should be used for scientific analysis with extreme caution.
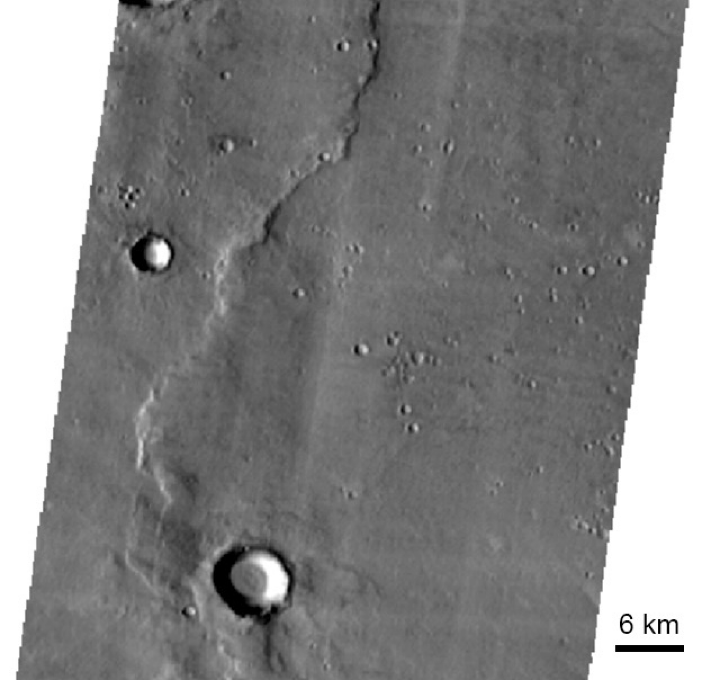
Figure 3: THEMIS maximum brightness temperature image I49524003 illustrating subtle row- and column-correlated noise (i.e., plaid). This image is still fit for scientific use, but the user should be aware of how these variations may impact quantitative interpretations.
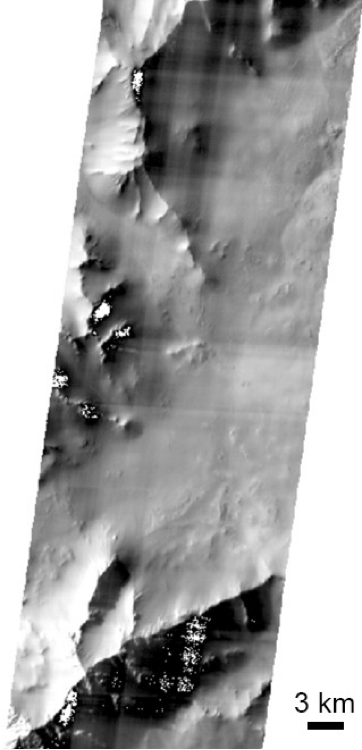
Figure 4: THEMIS maximum brightness temperature image I36470001 illustrating both saturated pixels due to a noisy image and extensive row- and column-correlated noise. This image is not appropriate for scientific investigation.
An over-saturation of a THEMIS pixel (or several pixels) can occur if the number of photons reaching the detector are above the threshold that the detector is able to measure. Over-saturation is observed as white areas in an image that do not correlate with surface features and are a type of image artifact. Sometimes, saturation is present due to actual surface phenomenon, such as the presence of CO2-ice, and a comparison of the measured temperature with that predicted for CO2-ice at that elevation, season, local time, and atmospheric pressure should be carefully evaluated. However, often pixels that are over-saturated do not represent the true nature of the surface and are not appropriate for scientific analysis. Figure 4 contains saturated pixel values, which can be seen as white pixels that are non-uniform and are data artifacts. The fact that there is extensive row- and column-correlated noise also present in this image is further indication that this image is not appropriate for scientific investigation.
THEMIS images sometimes have a lower than what we expect, based on our knowledge of Martian surface temperature ranges, the temperature of CO2 ice in a Martian environment, and thermal model results. The average temperature of CO2 ice on Mars is 148 Kelvin (K). This is the lowest realistic temperature on Mars because at 148 K CO2 will condense out of the atmosphere and onto the surface, stabilizing the surface temperature at the freezing point. Any temperature value significantly lower than 148 K should be considered problematic and that image not used for quantitative analysis. Temperatures may be slightly lower than 148 K depending on the season, elevation, and atmospheric pressure, and such circumstances should be evaluated with caution and expert assessment.
As described above, these products were rigorously inspected to identify and correct mis-registrations between THEMIS images. However, no data product is perfect and minor mis-registrations between images exist. Mis-registrations between images indicate that the position of one or more images in that region has larger uncertainties. These mis-registrations can be observed as features – such as craters or fissures – that do not align at THEMIS image boundaries when mosaicked together (see Figure 2).
These controlled products help meet a common need among researchers to accurately co-locate data sets of varying spatial scales and data types to aid in addressing multi-disciplinary questions and allow for precision science to be accomplished. For example, these products allow one to compare the registration between this thermal data set and higher-resolution visible data, topography, and composition data, and potentially improve the geometric registration between datasets. Once these data are well-registered, they can be imported into a GIS program and statistical comparisons between surface units or properties can be accurately compared and analyzed. Any data product, such as elevation, composition, or visible images, aligned with the Mars Orbiter Laser Altimeter (MOLA) ( Citation: Zuber, Smith & al., 1992 Zuber, M., Smith, D., Solomon, S., Muhleman, D., Head, J., Garvin, J., Abshire, J. & Bufton, J. (1992). The Mars Observer laser altimeter investigation. Journal of Geophysical Research: Planets, 97(E5). 7781–7797. https://doi.org/https://doi.org/10.1029/92JE00341 ; Citation: Smith, Zuber & al., 2001 Smith, D., Zuber, M., Frey, H., Garvin, J., Head, J., Muhleman, D., Pettengill, G., Phillips, R., Solomon, S., Zwally, H., Banerdt, W., Duxbury, T., Golombek, M., Lemoine, F., Neumann, G., Rowlands, D., Aharonson, O., Ford, P., Ivanov, A., Johnson, C., McGovern, P., Abshire, J., Afzal, R. & Sun, X. (2001). Mars Orbiter Laser Altimeter: Experiment summary after the first year of global mapping of Mars. Journal of Geophysical Research: Planets, 106(E10). 23689–23722. https://doi.org/https://doi.org/10.1029/2000JE001364 ) ; dataset will also be well-registered to the controlled THEMIS images.
As a global data set of intermediate spatial scale, the controlled THEMIS daytime infrared and nighttime infrared products also enable the accurate co-registration of higher-resolution Martian data sets, such as Context Camera (CTX) ( Citation: Malin, Bell III & al., 2007 Malin, M., Bell III, J., Cantor, B., Caplinger, M., Calvin, W., Clancy, R., Edgett, K., Edwards, L., Haberle, R., James, P., Lee, S., Ravine, M., Thomas, P. & Wolff, M. (2007). Context Camera Investigation on board the Mars Reconnaissance Orbiter. Journal of Geophysical Research: Planets, 112(E5). https://doi.org/https://doi.org/10.1029/2006JE002808 ) ; and HiRISE images. This accurate base is necessary to facilitate the co-location of data (e.g., data fusion) with known, quantifiable errors, and provides a foundation to which all other Martian data sets intersecting the network can then be registered. In addition, the THEMIS controlled products can be used as an accurate ground “truth” dataset to control higher resolution data and is currently being used as the base for CTX controlled mosaics.
- Archinal, B., Kirk, R., Duxbury, T., Lee, E., Sucharski, R. & Cook, D. (2003). Mars Digital Image Model 2.1 Control Network.
- Archinal, B., Weller, L., Sides, S., Cushing, G., Kirk, R., Soderblom, L. & Duxbury, T. (2004). Preparing for Themis Controlled Global Mars Mosaics.
- Bandfield, J., Rogers, D., Smith, M. & Christensen, P. (2004). Atmospheric correction and surface spectral unit mapping using Thermal Emission Imaging System data. Journal of Geophysical Research: Planets, 109(E10). https://doi.org/https://doi.org/10.1029/2004JE002289
- Christensen, P., Jakosky, B., Kieffer, H., Malin, M., McSween, H., Nealson, K., Mehall, G., Silverman, S., Ferry, S., Caplinger, M. & Ravine, M. (2004). The Thermal Emission Imaging System (THEMIS) for the Mars 2001 Odyssey Mission. Space Science Reviews, 110(1). 85–130. https://doi.org/10.1023/B:SPAC.0000021008.16305.94
- Edwards, C., Nowicki, K., Christensen, P., Hill, J., Gorelick, N. & Murray, K. (2011). Mosaicking of global planetary image datasets: 1. Techniques and data processing for Thermal Emission Imaging System (THEMIS) multi-spectral data. Journal of Geophysical Research: Planets, 116(E10). https://doi.org/https://doi.org/10.1029/2010JE003755
- Fergason, R., Christensen, P. & Kieffer, H. (2006). High-resolution thermal inertia derived from the Thermal Emission Imaging System (THEMIS): Thermal model and applications. Journal of Geophysical Research: Planets, 111(E12). https://doi.org/https://doi.org/10.1029/2006JE002735
- Fergason, R., Weller, L. & Bland, M. (2026). The THEMIS Control Network of Mars. Earth and Space Science, 13(1). e2025EA004758. https://doi.org/https://doi.org/10.1029/2025EA004758
- Jaumann, R., Neukum, G., Behnke, T., Duxbury, T., Eichentopf, K., Flohrer, J., Gasselt, S., Giese, B., Gwinner, K., Hauber, E., Hoffmann, H., Hoffmeister, A., Köhler, U., Matz, K., McCord, T., Mertens, V., Oberst, J., Pischel, R., Reiss, D., Ress, E., Roatsch, T., Saiger, P., Scholten, F., Schwarz, G., Stephan, K. & Wählisch, M. (2007). The high-resolution stereo camera (HRSC) experiment on Mars Express: Instrument aspects and experiment conduct from interplanetary cruise through the nominal mission. Planetary and Space Science, 55(7). 928–952. https://doi.org/https://doi.org/10.1016/j.pss.2006.12.003
- Malin, M., Bell III, J., Cantor, B., Caplinger, M., Calvin, W., Clancy, R., Edgett, K., Edwards, L., Haberle, R., James, P., Lee, S., Ravine, M., Thomas, P. & Wolff, M. (2007). Context Camera Investigation on board the Mars Reconnaissance Orbiter. Journal of Geophysical Research: Planets, 112(E5). https://doi.org/https://doi.org/10.1029/2006JE002808
- Nowicki, K., Edwards, C. & Christensen, P. (2013). Post-projection removal of row- and column-correlated noise in line-scanning data: Application to THEMIS infrared data. https://doi.org/10.1109/WHISPERS.2013.8080692
- Smith, D., Zuber, M., Frey, H., Garvin, J., Head, J., Muhleman, D., Pettengill, G., Phillips, R., Solomon, S., Zwally, H., Banerdt, W., Duxbury, T., Golombek, M., Lemoine, F., Neumann, G., Rowlands, D., Aharonson, O., Ford, P., Ivanov, A., Johnson, C., McGovern, P., Abshire, J., Afzal, R. & Sun, X. (2001). Mars Orbiter Laser Altimeter: Experiment summary after the first year of global mapping of Mars. Journal of Geophysical Research: Planets, 106(E10). 23689–23722. https://doi.org/https://doi.org/10.1029/2000JE001364
- Zuber, M., Smith, D., Solomon, S., Muhleman, D., Head, J., Garvin, J., Abshire, J. & Bufton, J. (1992). The Mars Observer laser altimeter investigation. Journal of Geophysical Research: Planets, 97(E5). 7781–7797. https://doi.org/https://doi.org/10.1029/92JE00341